

This guide shows you how to use Gemini Notebook to create an interactive dashboard inspired by the reference below: a white sidebar, a blue header, four KPI cards, a country chart, and a currency converter.
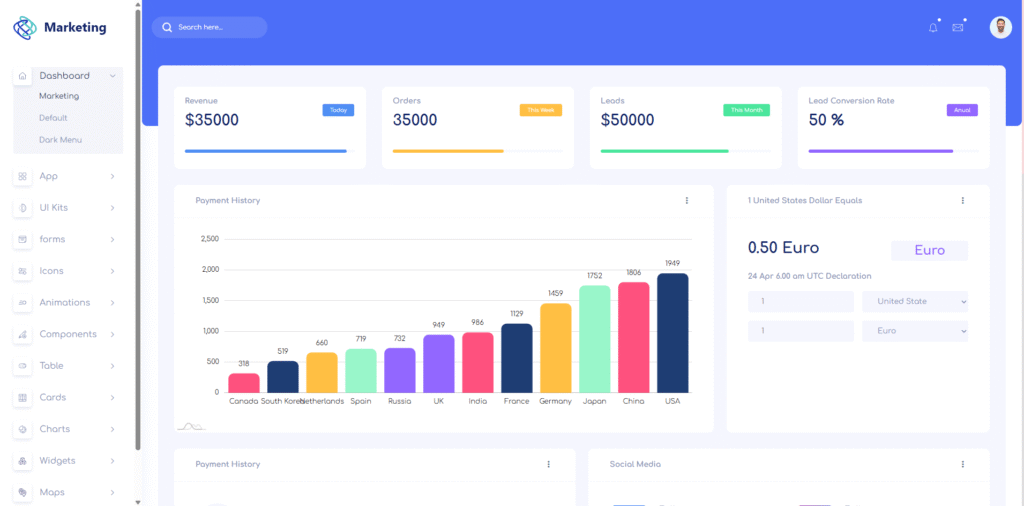
You will supply the image, add a short dashboard brief, generate the site, and test its controls. No coding is required for this workflow. The data below is fictional, and the checks describe expected behavior for you to verify.
Google documents site generation from notebook sources in its interactive sites announcement.
Step 1: Create a notebook and add the reference image
- Open Gemini Notebook on the web.
- Create a notebook named Marketing Dashboard Demo.
- Select Add sources and upload the reference dashboard image.
- Open the imported image to confirm it is available.
Images and pasted text are supported sources. Google’s source guide.
Identify the layout you want to reproduce:
- A white navigation sidebar with a Marketing heading.
- A blue header with a search field and profile controls.
- Four white KPI cards across the top.
- A large Payment History chart beside a smaller currency converter.
- A lower row with Payment History and Social Media panels.
Use the image for appearance and the written brief in Step 2 for exact data and behavior.
Step 2: Add the dashboard context as ordinary text
Select Add sources again, choose the option for pasted text, and name the source Marketing Dashboard Brief. Paste the following paragraphs as its content.
Context to paste:
Create a fictional marketing dashboard for a demonstration. Use only synthetic data; no internal business or customer information is involved. Display a visible Synthetic demo data label.
The four KPI cards show Revenue: $35,000; Orders: 35,000; Leads: 50,000; and Lead Conversion Rate: 50%. Use Demo snapshot as the period label on all four cards. Leads and Orders are counts, so do not display currency symbols for them.
The Payment History chart shows sample payment counts by country: Canada 318; South Korea 519; Netherlands 660; Spain 719; Russia 732; UK 949; India 986; France 1129; Germany 1459; Japan 1752; China 1806; USA 1949.
These country counts are a separate illustrative series, not a breakdown of the KPI cards. Search and country filters affect only the chart and country payment table. The KPI cards remain fixed.
The currency converter uses a fixed fictional rate: 1 USD equals 0.50 EUR. Converting EUR to USD uses the inverse rate. Label the widget Demo rate — not live market data. Do not fetch external exchange rates.
For the partially visible lower row, add a country payment table using the chart data and a Social Media summary showing Facebook 45%, Instagram 35%, and LinkedIn 20%. These are proposed demo contents for panels whose details are not visible in the reference.
Before continuing: check that both the image and Marketing Dashboard Brief are listed as notebook sources.
Step 3: Ask Gemini Notebook to generate the dashboard
In Chat, paste the following request as ordinary text.
Prompt to paste:
Make me a site using the uploaded dashboard image and Marketing Dashboard Brief. Write the interface in English.
Recreate the reference layout: a white sidebar approximately 250 pixels wide, a blue header, a pale lavender content background, and white cards with rounded corners. Use dark navy text, subtle borders, and generous spacing. Put four equally sized KPI cards in one row on desktop. Below them, place Payment History across roughly two-thirds of the available width and the currency converter in the remaining third. Add the country table and Social Media summary underneath.
Use all numbers and units from the brief exactly. Display Leads as a count. Label the chart Payment History and its measure Payment count. Keep the Synthetic demo data label visible. If you add progress bars to the KPI cards, mark them as decorative rather than inventing targets.
Make these controls work:
- The header search filters country names in the chart and country table, ignoring letter case. Show a clear empty state when nothing matches.
- A chart selector switches between All countries and Top 5. Top 5 means the five largest payment counts within the current search results. Search and this selector work together.
- Chart tooltips show the country and payment count.
- The currency widget accepts an amount and USD or EUR as source and target currencies. Use only the fixed demo rate. Same-currency conversion returns the original amount. Reject blank, negative, and nonnumeric amounts.
- Sidebar links move to the dashboard sections. On mobile, a menu button opens and closes the sidebar.
Use a simple placeholder logo and avatar. Stack cards and panels on narrow screens and keep chart labels readable. Treat notification and message icons as decorative; do not invent inboxes or live notifications. If a requested interaction is unavailable, state the limitation.
This is a request for a generated site, not for source code to paste into an editor. Google describes this Chat workflow in its site generation guide.
Step 4: Open the site and compare its layout with the image
When generation finishes, select the site in Studio and use Open in new tab. Opening generated sites.
Check these five items before recording:
- The sidebar, header, and main content form the same overall arrangement as the reference.
- All four KPI cards fit in one desktop row with consistent height and spacing.
- The chart is wider than the converter, and both panels align at the top.
- All 12 countries appear when search is empty and All countries is selected.
- Country labels, values, and lower panels remain readable when you scroll or resize the window.
The main priorities are the page structure, readable data, and working controls. Small differences in icons or fonts are acceptable for this demonstration.
Step 5: Test the interactions with these exact actions
| Action | Expected result |
|---|---|
| Search for Japan | The chart and table show Japan with 1,752 payments; KPI cards stay fixed |
| Search for a country name absent from the data | A clear no-results message appears |
| Clear search and select Top 5 | USA 1,949; China 1,806; Japan 1,752; Germany 1,459; France 1,129 |
| Hover over the USA bar | The tooltip identifies USA and 1,949 payments |
| Convert 100 USD to EUR | 50 EUR using the fixed demo rate |
| Convert 100 EUR to USD | 200 USD using the inverse demo rate |
| Convert 100 USD to USD | 100 USD |
| Leave the amount blank or enter a negative value | A validation message appears instead of a misleading amount |
| Open the page at phone width | Cards stack, labels remain readable, and the menu button toggles the sidebar |
Also check that the converter says Demo rate — not live market data. Record each check as passed, failed, or unavailable based on what you actually observe.
Step 6: Refine the result with a focused request
If the layout needs work, describe the specific change. Paste this example into Chat to request a revised version:
Refinement prompt:
Create a revised version of the marketing dashboard using the same sources. Keep all sample data and interaction rules unchanged. Make the desktop sidebar about 250 pixels wide, align the four KPI cards, and use a two-to-one width ratio for the chart and converter. Increase country-label spacing so names do not overlap. Below 768 pixels, stack the panels and use a collapsible sidebar. Preserve country search, Top 5 filtering, tooltips, and currency validation.
If a calculation fails, identify the input and expected result directly. For example: converting 100 EUR to USD must return 200 USD because the fixed demo rate is 1 USD equals 0.50 EUR.
After a revision, repeat the affected checks. If you edit the source brief, confirm the site reflects it; existing Studio outputs do not automatically change when sources are updated. Source update behavior.
Step 7: Document implementation results and compare with traditional RAG
Record the results objectively
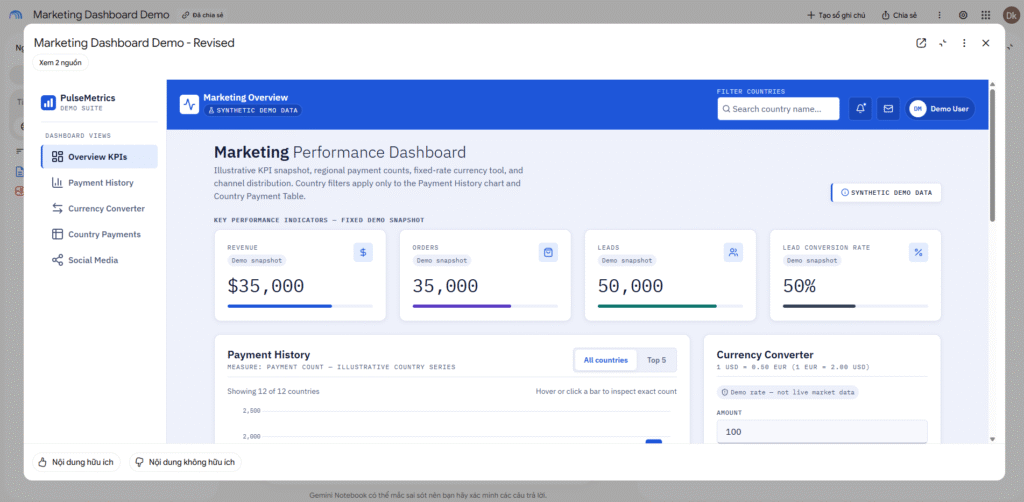
After completing Step 5, record the actual output, pass/fail status, and screenshot for each check. Include generation time, revision count, and any unavailable features. No results from a Gemini Notebook implementation have been supplied for this tutorial, so the checks below remain unverified.
| Evaluation area | Expected behavior | Observed result |
|---|---|---|
| Layout | Four KPI cards, a wide chart, and a narrower converter resembling the reference | As shown in the demo results |
| Data accuracy | All 12 countries match the brief; Japan has 1,752 payments | As shown in the demo results |
| Filtering | Searching Japan isolates its row and bar; Top 5 returns the five largest counts | As shown in the demo results |
| Calculations | 100 USD → 50 EUR; 100 EUR → 200 USD | As shown in the demo results |
| Validation and mobile behavior | Invalid amounts are rejected; cards stack and the sidebar toggles on mobile | As shown in the demo results |
Replace Not yet recorded with what you actually observe. Report partial success and failures alongside successful checks; keep expected behavior separate from observed output.
Clarify the difference from traditional RAG
RAG retrieves relevant external information and uses it as context for a model to generate an answer. Original RAG paper.
The following is a conceptual comparison with typical RAG-based document Q&A, not a measured benchmark.
| Aspect | Typical RAG-based Q&A | This dashboard generation workflow |
|---|---|---|
| Main purpose | Answer a question using retrieved information | Produce a reusable interface from an image and written brief |
| Typical flow | Question → retrieval → model-generated answer | Reference sources and prompt → generated site → user interaction |
| Japan example | Ask about Japan’s payment count and receive a source-grounded answer | Type Japan to filter the chart and table to 1,752 payments |
| What to evaluate | Retrieval relevance, answer accuracy, and supporting evidence | Also test layout, filter logic, calculations, validation, and mobile behavior |
This distinction concerns the workflow and output. RAG grounds generation through retrieval, while a dashboard is an interface; they can be combined. Google Cloud’s retrieval and generation guide.
A country filter or currency calculation does not demonstrate RAG. This tutorial has not inspected Gemini Notebook’s internal retrieval architecture or run a RAG baseline, so it cannot establish whether RAG is used internally or whether this approach is faster, cheaper, or more accurate.
Where I would use this workflow
I would use this approach to turn a dashboard reference and a short brief into a prototype for stakeholder discussions, report layouts, or internal-tool planning. A working prototype lets people test filters and calculations while discussing the design.
Before connecting real data, I would verify the metric definitions, calculations, access requirements, and update process. The useful outcome of this exercise is a dashboard you can demonstrate and evaluate with concrete checks.
Link book Demo :
https://notebook.google.com/notebook/6c6a7143-ceda-493a-8a65-f5b480837f49