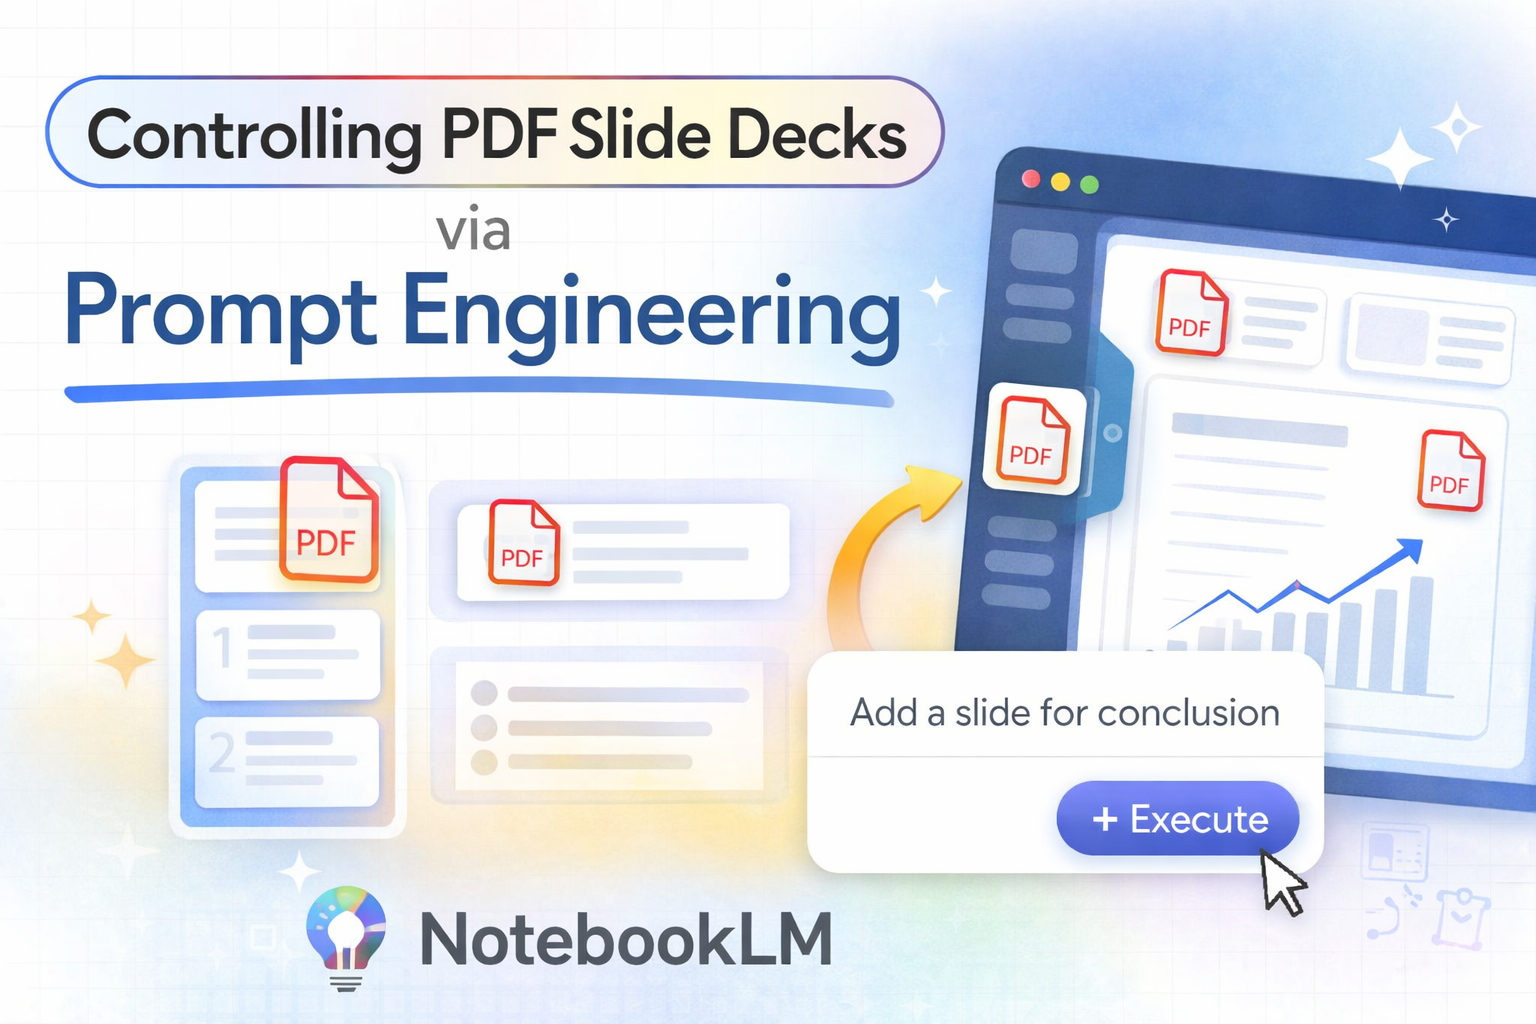
1. What is NotebookLM Slide Deck?
Google NotebookLM is an AI-powered research platform that lets you upload multiple source documents (PDFs, Google Docs, web URLs, YouTube videos, etc.) and interact with them through intelligent chat. The Slide Deck feature (launched late 2025) auto-generates presentations from your uploaded sources using the Nano Banana Pro image model.
How It Compares to Other AI Slide Tools
| Criteria | NotebookLM Slide Deck | Gemini in Google Slides | Canva AI / Gamma |
|---|---|---|---|
| Data Sources | Multi-source (PDF, Docs, Web, YouTube) | Text prompt or single file | Text prompt |
| Factual Grounding | High — grounded in uploaded sources | Medium — may hallucinate | Low — prompt-dependent |
| Custom Prompt | Yes — outline, tone, visual | Yes — limited | Yes |
| Per-slide Revision | Yes | Yes (side panel) | Yes |
| Export Formats | PDF, PPTX | Native Google Slides | PDF, PPTX, link |
| Slide Rendering | Image-based (rendered) | Native editable | Editable |
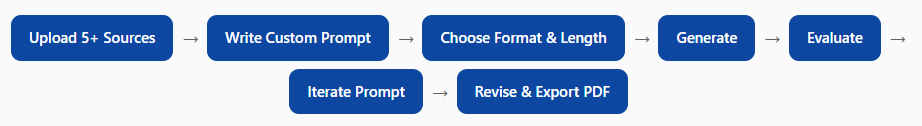
Overall Workflow
2. Source Pack — 7 Sources & Why We Chose Them
For this demonstration, we use the scenario of an EdTech company “EduNova” preparing a slide deck titled “2025 Annual Report & AI Product Vision 2026” for their Board of Directors. Here are the 7 selected sources:
| # | Source Document | Type | Why We Chose It |
|---|---|---|---|
| 1 | EduNova 2025 Annual Report | Contains financial data (revenue, growth, user count), KPIs, and business strategy — primary data source for Executive Summary and Revenue slides | |
| 2 | AI Product Strategy Doc 2026 | Google Docs | Product roadmap, AI feature specs (AI Tutor, Content Gen, Analytics), deployment timeline — core content for Strategic Pillars and Roadmap sections |
| 3 | Blog post on AI in education (Google Blog: Gemini for Educators) | Web URL | Latest information from Google on AI tools for education (Gemini, NotebookLM, Workspace Studio) — ensures factual grounding on technology trends and industry context |
| 4 | TED Talk: “How AI Could Save Education” — Sal Khan | YouTube | Vision for AI in education from the Khan Academy CEO — helps NotebookLM capture an inspiring tone and narrative about personalized AI tutoring (aligns with EduNova’s Pillar 1) |
| 5 | EduNova Brand Guidelines | Color codes (#0d47a1, #ff6d00), typography (Inter/Roboto), logo rules — NotebookLM references this to maintain brand consistency | |
| 6 | Vietnam EdTech Market Report 2025 | Market context, trends, competitive landscape — adds analytical depth to the Market Landscape section | |
| 7 | Current EduNova Investor Deck (Q4 2025) | Google Slides | Reference for existing presentation style (layout, data visualization) — maintains consistency with previous materials |
Principles for Effective Source Selection
- Diverse formats: Combine PDF + Docs + Web + Video + Slides for multi-angle synthesis
- Cover 4 content layers: Data (Report) + Strategy (Docs) + Industry Context (Web + Video) + Brand (Guidelines)
- Trustworthy: Prioritize official company or reputable third-party documents
- Current: Use the latest materials — avoid data older than 2 years
- Upload brand book separately: This is the “cheat code” for brand-consistent slides
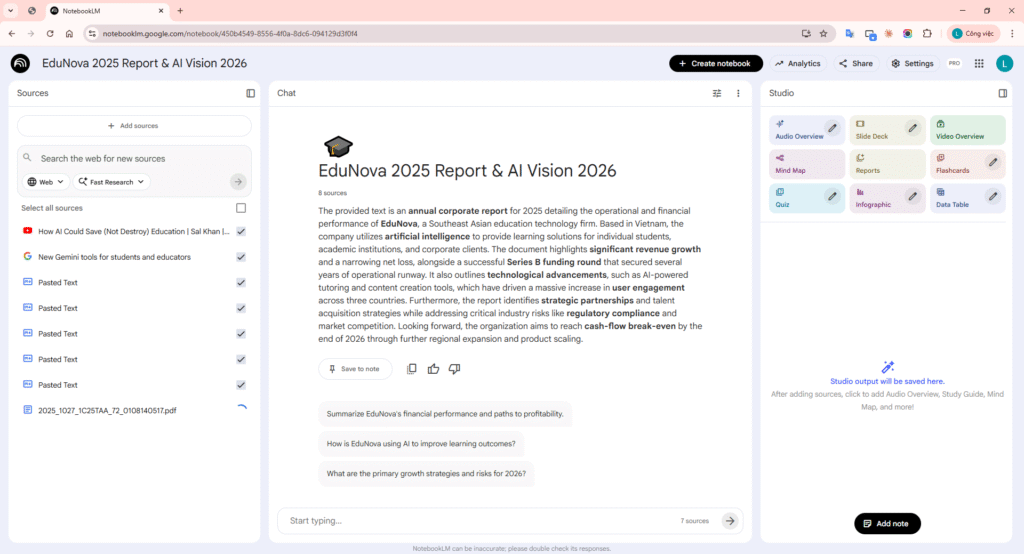
NotebookLM with 7 uploaded sources in the Sources panel
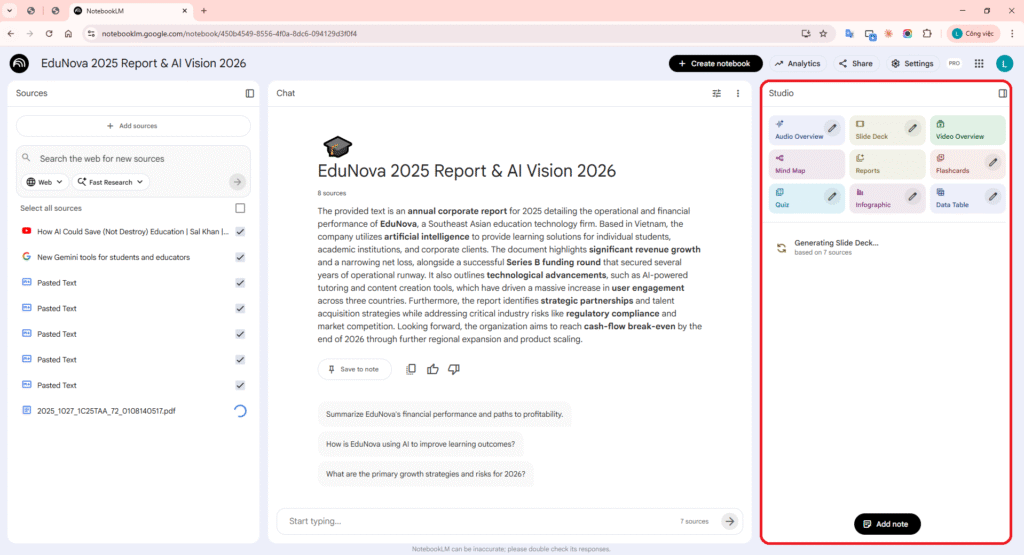
Studio panel showing the Slide Deck option
3. Iteration 1 — Prompt V1
NotebookLM allows you to enter a Custom Prompt in the customization panel before generating. This prompt is the “control brain” that determines output quality. We need to control three aspects:
Three Aspects to Control via Prompt:
- (a) Slide Outline — Structure, number of slides, content per section
- (b) Tone — Audience, voice, level of detail
- (c) Visual Style — Colors, typography, layout, data visualization
V1-3a. Controlling Slide Outline (Structure)
Goal: Define the exact structure of the presentation — sections, slide count, and main content per slide.
PROMPT V1 — OUTLINE:
Create a 14-slide detailed deck about EduNova’s 2025 Annual Report and AI Product Vision 2026. Slide 1: Title — “EduNova 2025 Annual Report & AI Vision 2026”, company logo area, date Slide 2: Agenda / Table of Contents — list all sections Slides 3–4: Executive Summary — key 2025 achievements (revenue, user growth, product launches) Slide 5: Market Landscape — EdTech industry trends in Vietnam and SEA Slide 6: Competitive Positioning — where EduNova stands vs competitors Slides 7–9: Three AI Strategic Pillars (one per slide): – Pillar 1: AI-Powered Personalized Tutoring – Pillar 2: Generative Content Creation for Teachers – Pillar 3: Predictive Learning Analytics Slide 10: Product Roadmap — Q1–Q4 2026 milestones Slide 11: Team & Investment — headcount growth, budget allocation Slide 12: Key Risks and Mitigation Strategies Slide 13: Key Metrics & KPIs — dashboard-style with target numbers Slide 14: Call to Action & Next Steps Use bullet points. Maximum 6 bullets per slide. Prioritize data from the Annual Report and Product Strategy sources.
Prompt Technique Analysis — Outline:
- Specific slide count (14): Tightly controls deck length — NotebookLM will target exactly that number
- Per-slide content: “Slide 3–4: Executive Summary” leaves no room for AI to freelance
- Logical grouping: Related slides grouped (3–4 for summary, 7–9 for pillars) ensures narrative flow
- Source reference: “Prioritize data from Annual Report” directs where AI should pull data from
- Format constraint: “bullet points, max 6 bullets” controls content density
V1-3b. Controlling Tone (Voice & Audience)
PROMPT V1 — TONE:
Audience: Board of Directors and potential investors. Tone: Professional, confident, data-driven, and forward-looking. Language style: Executive briefing — concise sentences, no technical jargon. Avoid: Code snippets, implementation details, overly casual phrasing. Each slide should feel like a CEO presenting at an annual shareholders meeting.
Prompt Technique Analysis — Tone:
- Specific audience: “Board of Directors and investors” determines the right level of detail
- Four tone words: “Professional, confident, data-driven, forward-looking” sets the emotional frame
- Negative instruction: “Avoid code snippets, implementation details” removes unwanted content types
- Strong analogy: “CEO presenting at annual shareholders meeting” — AI instantly understands the context
V1-3c. Controlling Visual Style (Design)
PROMPT V1 — VISUAL STYLE:
Visual design guidelines: – Color palette: Primary dark blue (#0d47a1), accent orange (#ff6d00), white background, light gray (#f5f5f5) for cards – Typography: Modern sans-serif headings (bold, large), clean body text – Layout: Left-aligned content with generous whitespace – Data visualization: Use clean bar charts, donut charts, or stat cards for numbers – Images: Abstract geometric illustrations, no stock photos of people – Every slide should have a thin blue header stripe with the section title – Use flat, single-color icons to supplement text
Prompt Technique Analysis — Visual:
- Hex codes: “#0d47a1” and “#ff6d00” — NotebookLM interprets these approximately (not pixel-perfect, but close)
- Typography direction: “Modern sans-serif, bold headings” guides font style without naming a specific font
- Layout principle: “Left-aligned, generous whitespace” provides clear layout rules
- Consistency element: “thin blue header stripe” creates a repeating element across all slides
- Negative instruction: “no stock photos of people” eliminates generic imagery
Combined V1 Prompt (Entered into NotebookLM)
All three aspects are merged into a single prompt for the Custom Prompt field:
COMBINED PROMPT V1:
Create a 14-slide detailed deck: “EduNova 2025 Annual Report & AI Vision 2026”. STRUCTURE: – Slide 1: Title — company name, subtitle, date – Slide 2: Agenda — list all sections – Slides 3–4: Executive Summary — 2025 key achievements (revenue, users, product launches) – Slide 5: Market Landscape — EdTech trends in Vietnam and SEA – Slide 6: Competitive Positioning — EduNova vs competitors – Slides 7–9: Three AI Strategic Pillars (one per slide): Pillar 1: AI Personalized Tutoring Pillar 2: Generative Content Creation for Teachers Pillar 3: Predictive Learning Analytics – Slide 10: Product Roadmap — Q1–Q4 2026 milestones – Slide 11: Team & Investment — headcount, budget allocation – Slide 12: Key Risks and Mitigation – Slide 13: KPI Dashboard — key metrics with targets – Slide 14: Call to Action & Next Steps TONE: – Audience: Board of Directors and investors – Professional, confident, data-driven, forward-looking – Executive briefing style — concise, no jargon – Each slide = CEO at annual shareholders meeting – Maximum 6 bullet points per slide VISUAL STYLE: – Colors: Dark blue (#0d47a1), accent orange (#ff6d00), white backgrounds, light gray (#f5f5f5) cards – Modern sans-serif typography, bold headings – Left-aligned, generous whitespace – Clean bar charts, donut charts, and stat cards for data – Abstract geometric illustrations — no stock photos – Thin blue header stripe on every slide with section label – Flat single-color icons Focus on Annual Report for data and Product Strategy Doc for roadmap content. Reference Brand Guidelines for visual consistency.
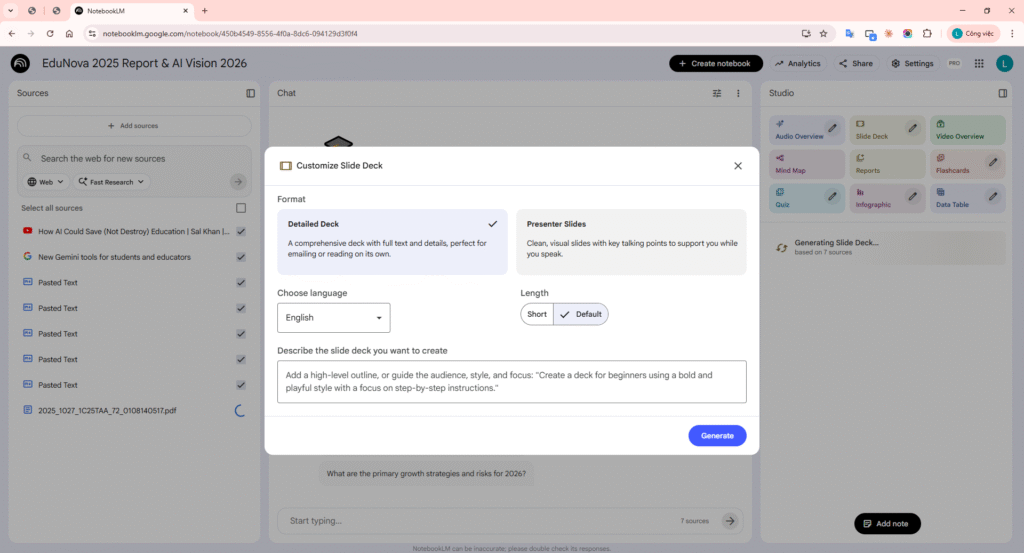
Customization panel — Format, Length, Language selected
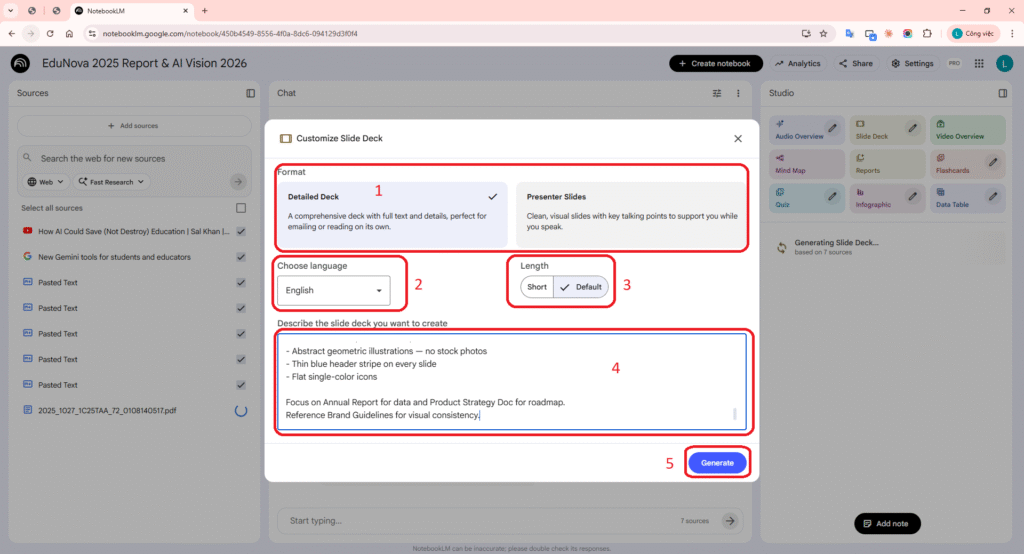
Combined Prompt V1 entered in Custom Prompt field
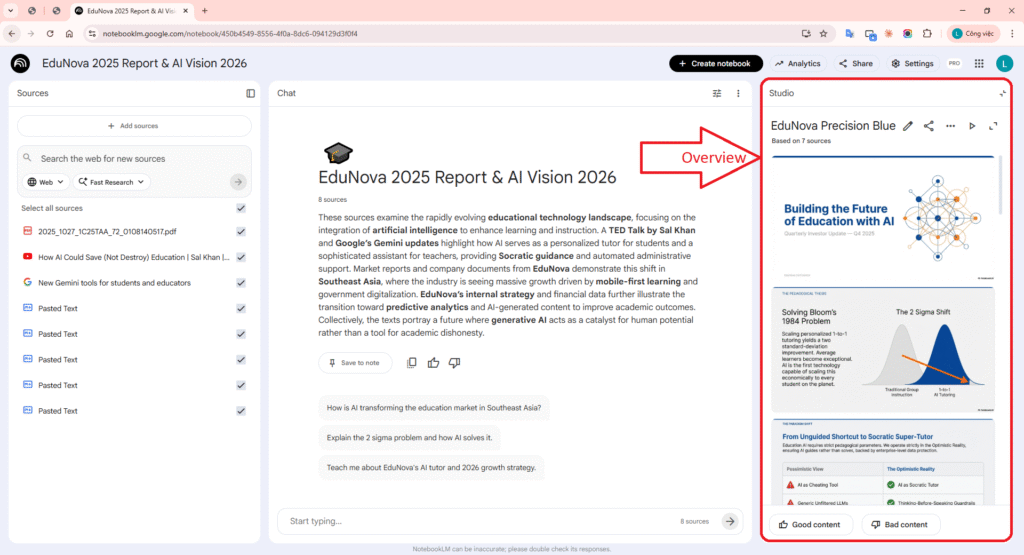
Slide Deck V1 — multi-slide overview after generation
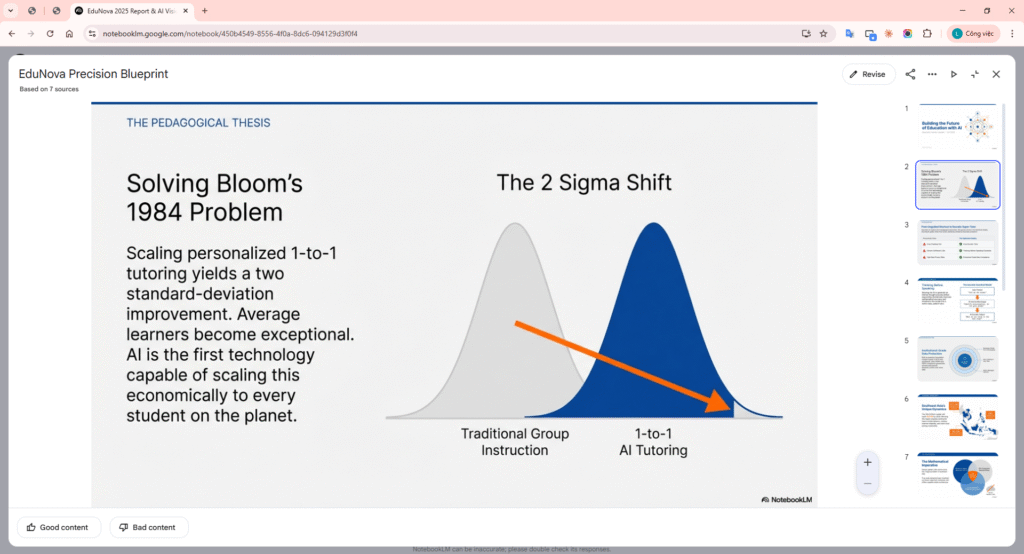
Slide V1 — 2–3 representative slides in detail
4. Evaluating V1 & Improvement Strategy
After generation, we need to evaluate the results. However, there is an important limitation: NotebookLM cannot directly view the generated slide deck. When asked to evaluate, it analyzes the source text against the Brand Guidelines rather than the visual output.
Real-world behavior when asking NotebookLM to evaluate:
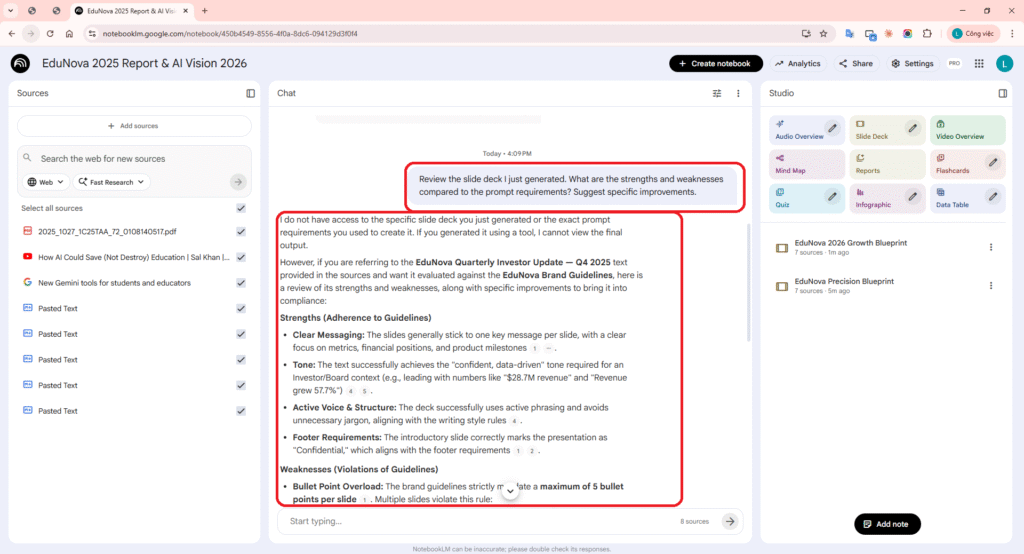
NotebookLM responds: “I do not have access to the specific slide deck you just generated. However, if you are referring to the source text, here is a review against the Brand Guidelines…”
→ NotebookLM can only evaluate source text vs Brand Guidelines — it cannot see the rendered slides. Therefore, we combine: (1) visual evaluation by eye + (2) content evaluation via NotebookLM chat.
4.1 NotebookLM Chat Evaluation (Content vs Brand Guidelines)
When asking NotebookLM: “Review the slide deck content against the Brand Guidelines. What are the strengths and weaknesses?”, it returns:
Strengths (NotebookLM feedback)
- Clear Messaging: Slides stick to one key message per slide, focused on metrics and milestones
- Correct Tone: Successfully achieves “confident, data-driven” tone for Board/Investor context — leading with numbers (“$28.7M revenue”, “Revenue grew 57.7%”)
- Active Voice: Uses active phrasing, avoids jargon — aligned with Brand Guidelines writing style rules
- Confidentiality: Opening slide correctly marked as “Confidential” per footer requirements
Weaknesses (NotebookLM feedback)
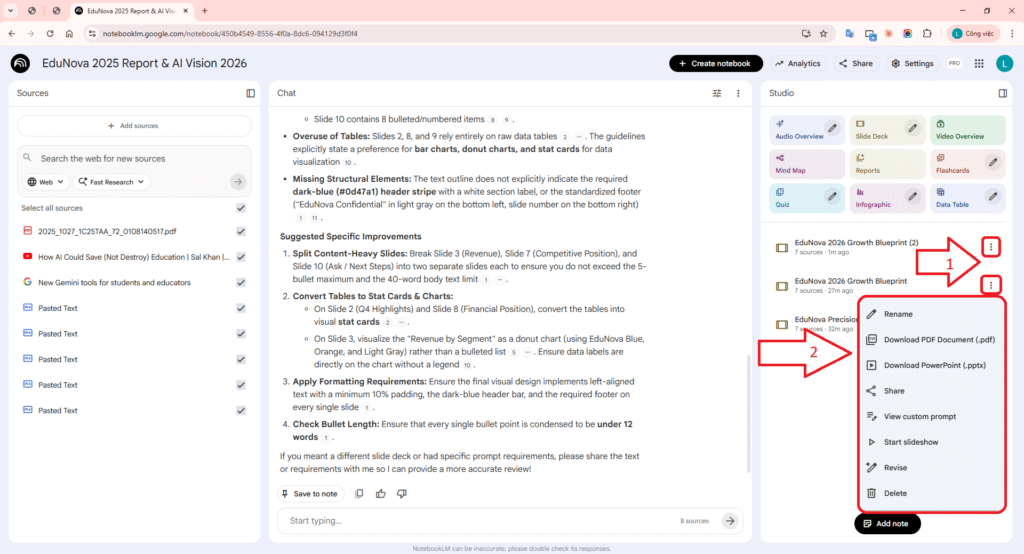
- Bullet Point Overload: Brand Guidelines mandate max 5 bullets/slide, but multiple slides violate this:
- Revenue slide: 7 bullets (3 segment + 4 quarter)
- Competitive slide: 7 bullets (4 advantages + 3 risks)
- CTA slide: 8 items
- Overuse of Tables: Several slides rely on raw data tables instead of the bar charts, donut charts, and stat cards recommended by Brand Guidelines
- Missing Structural Elements: Cannot confirm whether slides have the required dark-blue (#0d47a1) header stripe or standardized footer (“EduNova Confidential” + slide number)
4.2 Visual Evaluation by Eye (viewing generated slides)
In addition to NotebookLM chat feedback, we visually inspect the generated slides and note:
| Issue Found (visual) | Affected Criteria | Root Cause in V1 Prompt | Recommended Fix |
|---|---|---|---|
| Multiple slides use raw tables instead of stat cards / charts | Design | Prompt says “bar charts” generically without specifying which slide gets which chart | Specify per slide: “Slide 3: 4 stat cards in 2×2 grid”, “Slide 4: grouped bar chart” |
| Exceeding 5 bullets/slide on multiple slides (7–8 bullets) | Clarity, Design | V1 says “max 6 bullets” but Brand Guidelines require max 5 + max 12 words/bullet | Tighten to: “max 5 bullets, max 10 words each” + split heavy slides into two |
| Inconsistent colors — some slides use gradients or off-palette colors | Design | Prompt merely “suggests” palette, not strict enough | Add “STRICTLY use ONLY these colors” + “NO gradients, NO additional colors” |
| Header stripe missing on 3–4 slides | Design | “Every slide” instruction not strong enough | Emphasize “ALL 14 slides MUST have identical blue header stripe at top” |
| Roadmap slide displayed as bulleted list instead of timeline | Structure, Design | No visual format specified for roadmap | Add “HORIZONTAL TIMELINE with Q1→Q4 markers and milestone icons below” |
4.3 Specific Improvements Suggested by NotebookLM
- Split Content-Heavy Slides: Break Revenue, Competitive, and CTA slides into two slides each to stay within max 5 bullets and 40-word body text limit
- Convert Tables to Stat Cards & Charts:
- Q4 Highlights & Financial Position slides → convert tables to visual stat cards
- Revenue by Segment → use a donut chart (EduNova Blue, Orange, Light Gray) with data labels directly on chart
- Apply Formatting Requirements: Ensure every slide has left-aligned text with min 10% padding, dark-blue header bar, and standardized footer
- Check Bullet Length: Condense every bullet to under 12 words
4.4 Prompt Improvement Strategy
Combined improvement directions from both evaluation sources:
- Increase specificity: Describe layout AND visualization for each slide (2×2 grid, donut chart, horizontal timeline)
- Strengthen constraints: Use “MUST”, “ONLY”, “STRICTLY”, “NO” — Brand Guidelines say max 5 bullets, so the prompt should enforce it
- Reduce ambiguity: Replace “clean charts” with “grouped bar chart comparing 2024 vs 2025 revenue by segment with % labels”
- Add word limits: “Max 10 words per bullet”, “max 40 words body text per slide” (per Brand Guidelines)
- Explicit visual ratio: “60% visual / 40% text on every slide” (per Brand Guidelines 60/40 rule)
- Map Brand Guidelines rules: Explicitly restate Brand Guidelines rules in the prompt so NotebookLM adheres to them
NotebookLM Chat evaluating content vs Brand Guidelines
5. Exporting PDF & Screenshots
5.1 Per-slide Revision (Optional)
After V1 generation, you can fine-tune individual slides. If skipped: no need to capture step-08; proceed directly to export.
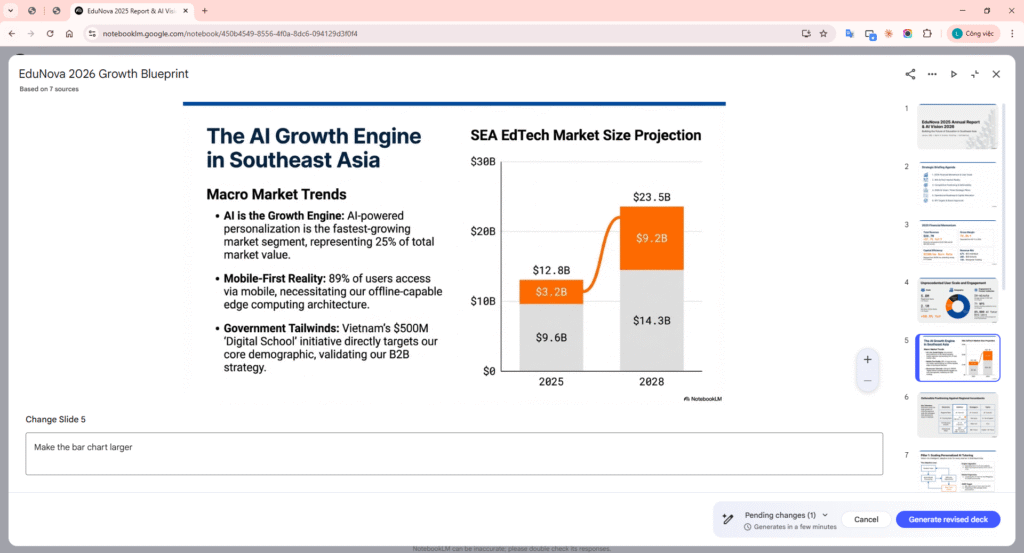
REVISION — Slide 4: Make the bar chart larger — it should fill 70% of the slide area. Add percentage change labels above each bar pair. Remove all body text except the chart title.
REVISION — Slide 10: The timeline should be perfectly horizontal. Use larger icons (at least 48px equivalent). Each quarter section should use alternating blue and gray background bands.
Important Notes on Revision:
- Each revision creates an entirely new slide set → batch all changes into “Pending Changes” and generate once
- Sources are not re-referenced during revision — only the new instruction is used
- There is a quota limit on revisions → plan ahead, batch instead of revising one by one
Optional: capture selected slide + instruction field + Apply button. If skipped, proceed to export.
5.2 PDF Export Process
1. In the Slide Deck viewer, click the three-dot menu (⋯) next to the slide deck name.
2. Select “Download PDF Document (.pdf)”. You can also choose “Download PowerPoint (.pptx)” for further editing.
3. The file downloads to your machine. Each slide becomes one PDF page (high-quality image, 16:9 aspect ratio).
4. Open the PDF in a viewer (Chrome, Edge, Adobe Reader) to verify final quality.
Click 3-dot menu (⋮) next to Slide Deck name — capture dropdown as soon as it opens.
Capture PDF viewer: .pdf filename on tab + content of 1–2 slides displayed.
Demo Link notebook: NotebookLM
PDF File Export from NotebookLM:
6. Quality Rubric & Improvement Proposals
Evaluate generated slides on four criteria (1–5 each, max 20):
- Structure — Follows requested outline (slide count, order, content)
- Clarity — Clear, concise; each slide conveys one idea
- Design — Consistent palette, typography, layout across slides
- Factual — Data traceable to sources; no invented numbers
Typical V1 score: 11/20 — Average. Design consistency and text density often need improvement.
Key improvement tips
- Be specific: Per-slide layout (e.g., “Slide 4: 2×2 stat cards”) beats generic “use charts”
- Use strong constraints: “MUST”, “ONLY”, “NO gradients” — not “should” or “prefer”
- Map sources: “Revenue → Annual Report, strategy → Product Doc” — tells AI where to pull data
- Verify after: NotebookLM can’t see slides. Ask chat: “List key numbers from Annual Report, cite source”
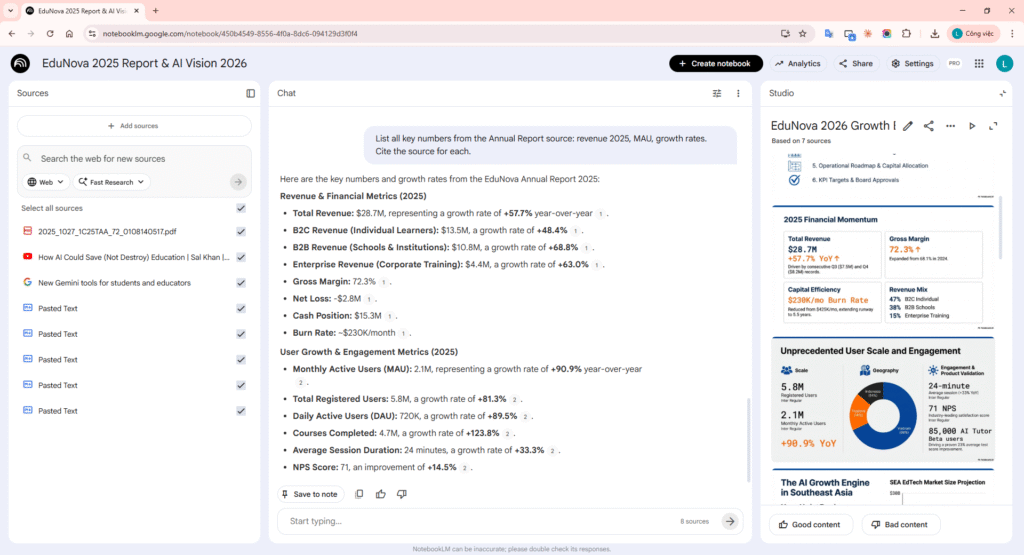
Ask to verify numbers in sources (e.g., “List key numbers from Annual Report, cite source”) — capture question + response.
7. Conclusion & Best Practices
7.1 Process Summary
7.2 Prompt Engineering Best Practices for NotebookLM Slide Decks
- Specificity is king: The more specific your prompt, the closer the output matches your intent
- Separate three layers: Always clearly divide STRUCTURE / TONE / VISUAL STYLE with their own headings in the prompt
- Use strong constraints: Use “MUST”, “ONLY”, “STRICTLY”, “NO” instead of “should”, “prefer”, “try to”
- Describe layouts, not just content: “2×2 grid of stat cards” > “show key metrics”
- Map sources explicitly: “Revenue data → Annual Report, Strategy → Product Doc” tells AI exactly where to pull data from
- Set word/number limits: “Max 10 words per bullet”, “max 40 words per slide” forces concise output
- Negative instructions are powerful: “NO stock photos, NO gradients, NO jargon” is more effective than “be clean”
- Iteration helps: No prompt is perfect on the first try. You can iterate: Generate → Evaluate → Refine → Regenerate to improve results
- Upload brand references: Brand guidelines + existing decks as separate sources = “cheat code” for design consistency
- Verify after generation: Use NotebookLM chat to cross-check every number in the slides against source material
7.3 When to Use NotebookLM Slide Deck
| Good Fit | Not the Best Fit |
|---|---|
| Quickly drafting presentations from multiple source documents | Pixel-perfect slides (use Figma/Canva instead) |
| Condensing lengthy research/reports into a presentation | Complex animations or embedded video |
| Brainstorming visual stories from raw data | Strict corporate templates (use Google Slides + template) |
| High factual grounding needed (data pulled from sources, not fabricated) | Real-time collaborative editing with multiple people |
| Quick sharing via PDF or link | Specialized fonts or specific language rendering requirements |
7.4 References
- How to Use Google’s NotebookLM to Automatically Generate Slides from Your Sources
- How to Create Slide Decks in NotebookLM (Step-by-Step Tutorial)
- A guide to using NotebookLM to compile documents and create slides | Dang Tu
- Google Help: Generate a Slide Deck in NotebookLM
- Google Blog: 8 ways to make the most out of Slide Decks