Overview of the Method
The core idea of this method is simple:
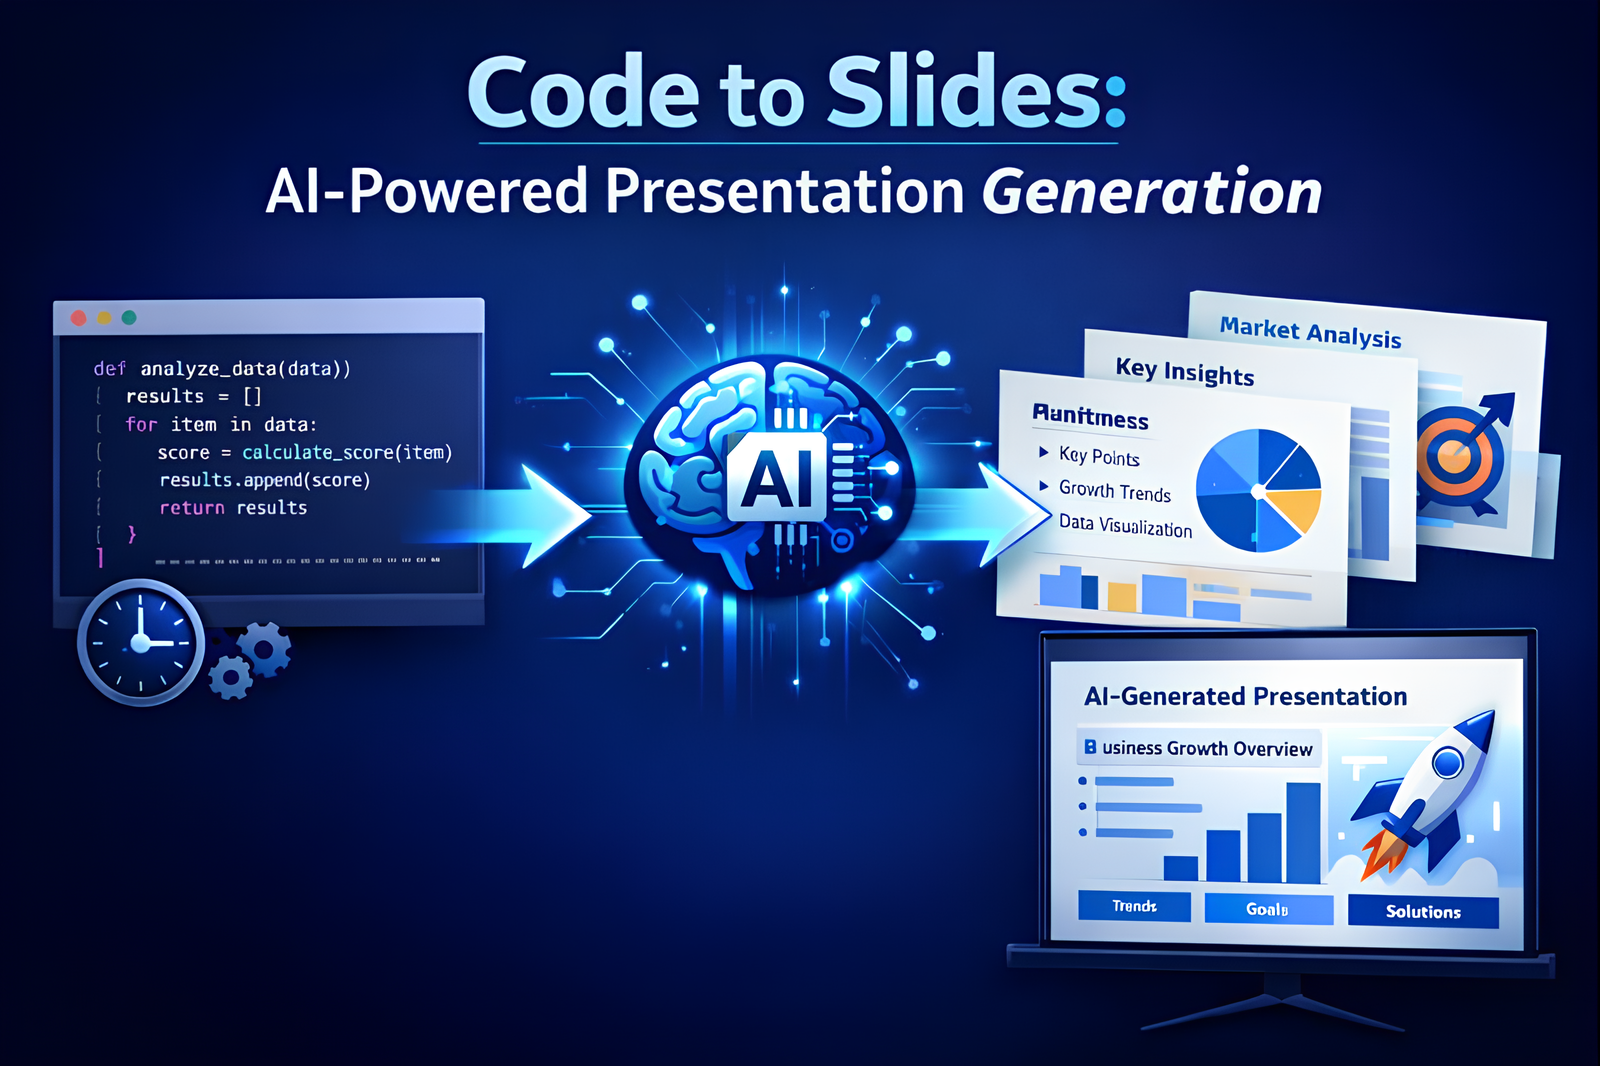
Use LLMs to understand and structure code logic, then use visuals to communicate that logic effectively.
Instead of manually translating code into slides, the workflow leverages:
– LLMs for reasoning and abstraction
– Visual generation for diagrams and flow explanations
– Fast iteration to improve clarity
This approach significantly reduces the time and effort required to create high-quality technical slides.
Why This Approach Is Effective
Traditional technical slides often fail because they:
– Contain too much raw code
– Overload slides with text
– Use visuals as decoration rather than explanation
This method solves those problems by:
– Prioritizing logical flow over syntax
– Making visuals the primary communication tool
– Treating slide creation as an iterative process assisted by LLMs
Summarize the Step-by-Step Process of This Method
Step 1: Select and Prepare the Code
Choose the algorithm or code segment you want to explain.
Clarify:
– Target audience
– Presentation goal
– Desired level of abstraction
Step 2: Use an LLM to Understand the Code
Provide the code to an LLM and request:
– A structured, high-level explanation
– Identification of key components
– Clear descriptions of data flow and control flow
This step converts code into **human-readable reasoning**.
Step 3: Design the Slide Structure
Based on the explanation:
– Break the logic into discrete concepts
– Assign one main idea per slide
– Arrange slides to tell a coherent story
At this stage, focus on *structure*, not visuals.
Step 4: Generate Visual Prompts
Ask the LLM to generate prompts for diagrams that explain:
– Processing steps
– Data transformations
– State transitions or decision points
The goal is functional clarity, not artistic design.
Step 5: Generate and Refine Visuals
Use an image generation model to create diagrams.
Iterate until:
– Each visual clearly explains a concept on its own
– Labels and relationships are easy to understand
– Visual style remains consistent across slides
Step 6: Assemble the Slides
Combine:
– Short, precise text
– Strong diagrams
– Descriptive slide titles
Slides should be understandable even without spoken explanation.
Step 7: Iterate and Optimize
Review the slides and refine:
– Remove unnecessary text
– Simplify diagrams
– Adjust explanations for the audience
Fast iteration is a key advantage of this workflow.
Key Principles to Remember
– Slides should explain **logic**, not raw code
– Visuals should carry most of the explanation
– LLMs are collaborators in thinking and structuring
– Iteration speed matters more than perfection
Demo
Step 1: Generate an initial prompt using Claude Code
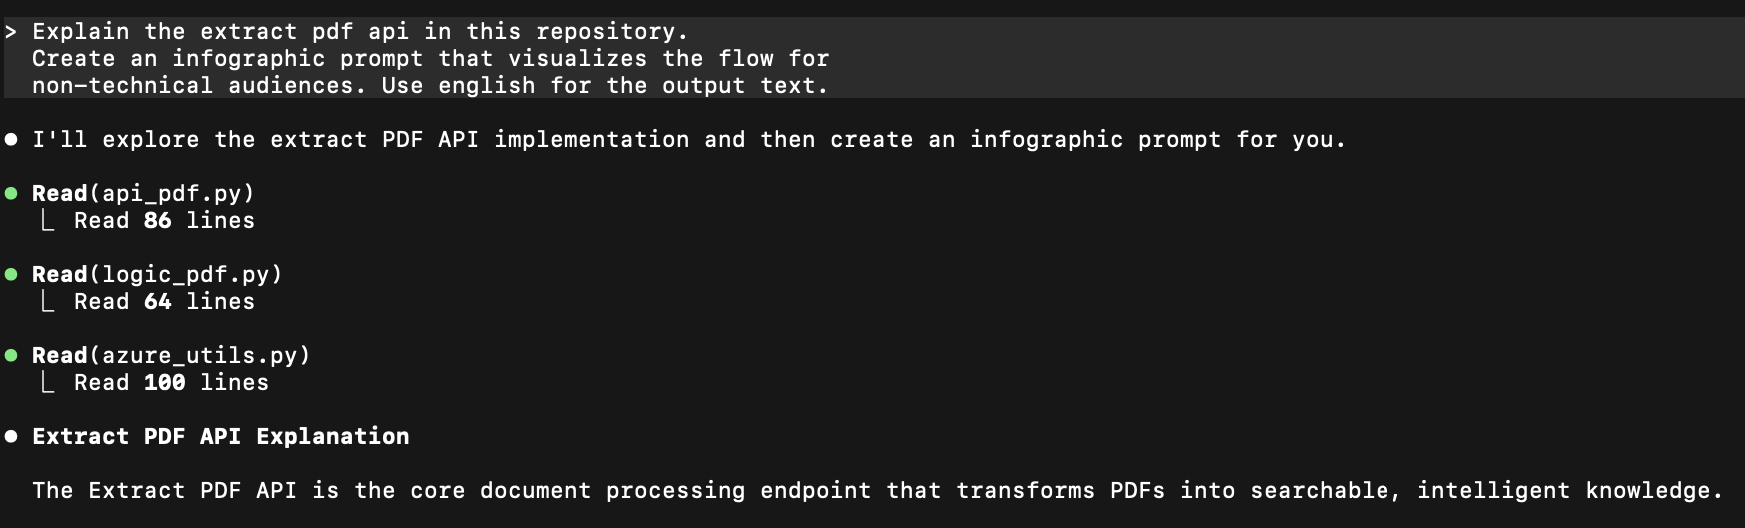
Step 2: Receive the prompt output from Claude Code
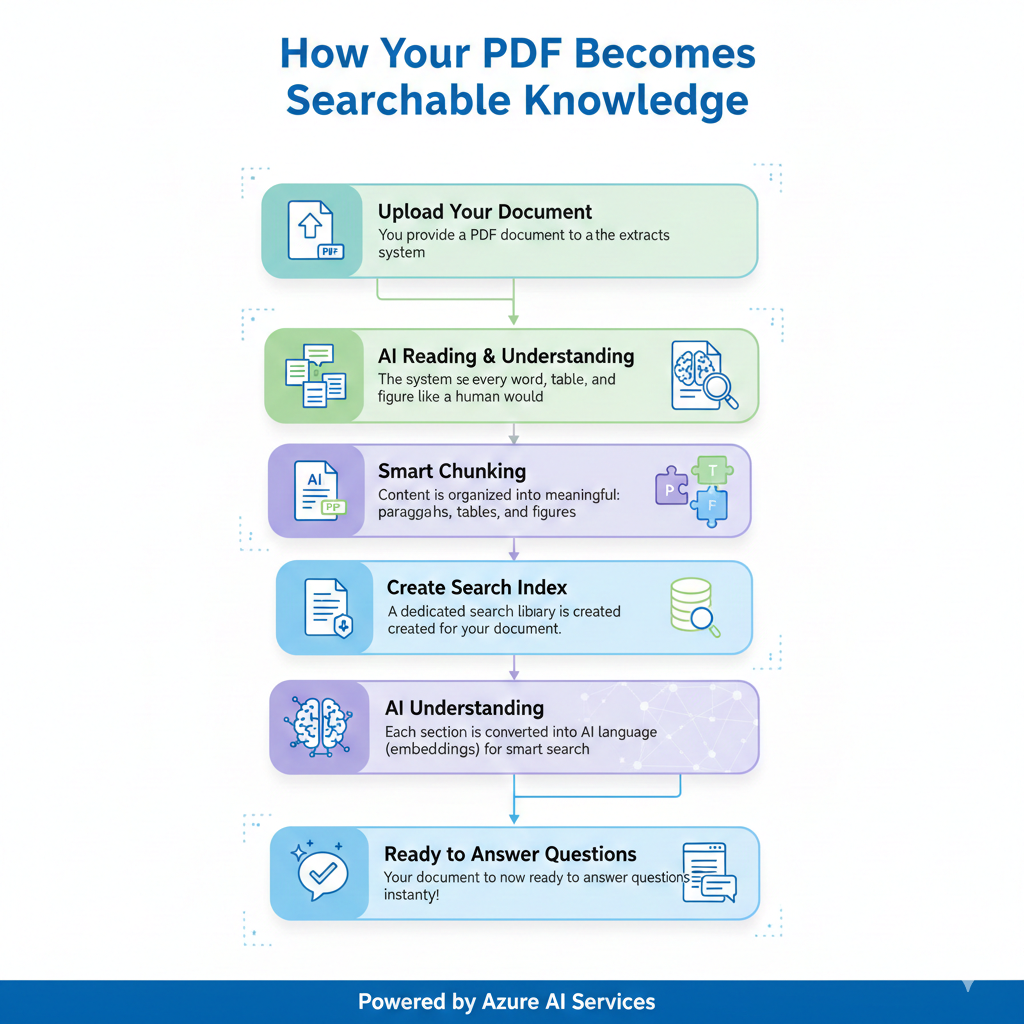
Create a clean, modern infographic showing a PDF document processing pipeline with 7 steps flowing from top to bottom or left to right. Use a friendly color palette (blues, greens, purples) with icons for each step. The style should be minimalist and professional, suitable for a business presentation.TITLE AT TOP: “How Your PDF Becomes Searchable Knowledge”STEP 1: “Upload Your Document”– Icon: PDF file with upload arrow– Text: “You provide a PDF document to the system”– Visual: Simple PDF iconSTEP 2: “Break Down the Pages”– Icon: PDF splitting into multiple page sheets– Text: “The system separates pages and extracts images”– Visual: One PDF becoming multiple page thumbnailsSTEP 3: “AI Reading & Understanding”– Icon: Robot/AI brain reading a document– Text: “Azure AI reads every word, table, and figure like a human would”– Visual: AI character with magnifying glass over documentSTEP 4: “Smart Chunking”– Icon: Document breaking into puzzle pieces– Text: “Content is organized into meaningful sections: paragraphs, tables, and figures”– Visual: Document transforming into labeled chunks (P, T, F badges)STEP 5: “Create Search Index”– Icon: Filing cabinet or database– Text: “A dedicated search library is created for your document”– Visual: Clean database/index structureSTEP 6: “AI Understanding”– Icon: Brain with network connections– Text: “Each section is converted into AI language (embeddings) for smart search”– Visual: Text transforming into glowing neural network patternSTEP 7: “Ready to Answer Questions”– Icon: Checkmark with chat bubble– Text: “Your document is now ready to answer questions instantly!”– Visual: Document with sparkles and a chat interfaceBOTTOM FOOTER: “Powered by Azure AI Services”Design notes:– Use arrows or connecting lines between steps to show flow– Each step should have equal visual weight– Include small decorative elements (dots, lines) to make it modern– Use 2-3 primary colors maximum for clarity– Add subtle shadows or depth to make it pop– Icons should be simple and universally understood– Text should be large enough to read on a slide presentation
Step 4: Test the prompt with NotebookLM
PDF_to_Knowledge_Transformation
Step 5: Create a second improved prompt
Create a presentation series showing how a PDF becomes an AI-powered Q&A system. This is Part 1 containing infographics 1-3. Use modern, clean design with blues, greens, and purples. Professional and minimalist style suitable for business presentations.—INFOGRAPHIC 1/6: “Overview – From PDF to Smart Answers”TITLE: “Turn Any PDF Into an AI-Powered Knowledge Assistant”LAYOUT: Left-to-right comparisonLEFT SIDE – “Before”:– Icon: Stack of static PDF documents– Text: “Traditional PDFs”– Bullet points:• Hard to search• Manual reading required• Information locked away– Visual: Gray/muted colors, dusty file cabinetCENTER – “Transformation”:– Icon: Magical wand or transformation arrows with sparkles– Text: “AI Processing Pipeline”– Visual: Flowing arrows with AI symbolsRIGHT SIDE – “After”:– Icon: PDF with chat bubble and sparkles– Text: “Intelligent Document”– Bullet points:• Instant answers• Natural language search• Context-aware responses– Visual: Bright colors, modern interface mockupBOTTOM TAGLINE: “Ask questions in plain English, get accurate answers with page references”—INFOGRAPHIC 2/6: “Document Processing – Steps 1 & 2”TITLE: “Phase 1: Document Preparation”SUBTITLE: “Breaking down your PDF for AI processing”VISUAL FLOW (Top to Bottom):STEP 1: “Upload Your Document”– Icon: Hand holding/uploading a PDF file-Visual:PDFfileflyingintoacloudorsystem-Text:”SimplyprovideyourPDF-anysize,anylanguage”-Statsbadge:”Supportsmulti-pagedocuments”↓ (Flowing arrow)STEP 2: “Intelligent Extraction”– Icon: PDF exploding/splitting into components– Visual: One PDF becoming:• Individual pages (shown as small thumbnails)• Extracted images (photo icons)• Text content (document lines)– Text: “The system separates your document into processable pieces”– Small labels on extracted items: “Pages”, “Images”, “Content”BOTTOM SECTION: “What Happens Behind the Scenes”– Small icon boxes showing:• “Each page isolated” (page icon)• “Images preserved” (image icon)• “Structure maintained” (layout icon)—INFOGRAPHIC 3/6: “AI Intelligence – Steps 3 & 4”TITLE: “Phase 2: AI Understanding”SUBTITLE: “Teaching AI to read like a human”VISUAL FLOW (Left to Right):STEP 3: “Azure AI Reads Everything”-Icon:AIrobot/brainwitheyesscanningadocument– Visual: Document with highlighted sections (paragraphs, tables, charts)– Text: “Advanced AI identifies and understands:”-Bulletbadges:• “Paragraphs” (P badge)• “Tables” (T badge with grid)• “Figures & Charts” (F badge with graph)– Tech badge: “Powered by Azure Document Intelligence”↓ (Transformation arrow)STEP 4: “Smart Organization”-Icon:Organizedfilingsystemorlabeledboxes-Visual:Documentcontentsortedintothreecolor-codedcategories:• BLUE boxes: “Paragraphs” (showing text lines)• GREEN boxes: “Tables”(showinggridstructure)• PURPLE boxes: “Figures”(showingcharticon)-Text:”Contentorganizedintomeaningful,searchablesections”-EachboxlabeledwithpagenumbertagsBOTTOM CALLOUT BOX:“Why This Matters: Like a librarian who knows exactly where every piece of information lives”—DESIGN SPECIFICATIONS:– Color palette: Blues, greens, purples (Microsoft Azure brand compatible)– Style: Modern, minimalist, professional– Icons: Simple, universally understood– Typography: Large, readable fonts for presentation slides– Arrows: Smooth, flowing connections between steps– Include subtle shadows or depth effects– Use 2-3 primary colors maximum per infographic– Number each as X/6 to show series progression
Create a presentation series showing how a PDF becomes an AI-powered Q&A system. This is Part 2 containing infographics 4-6. Use modern, clean design with blues, greens, and purples. Professional and minimalist style suitable for business presentations.—INFOGRAPHIC 4/6: “Search Intelligence – Steps 5 & 6”TITLE: “Phase 3: Creating Search Intelligence”SUBTITLE: “Making your document searchable by meaning, not just keywords”VISUAL FLOW (Top to Bottom with Side-by-Side Comparison):STEP 5: “Build Your Document Library”– Icon: Modern search index/database with document inside– Visual: All chunks flowing into organized library structure-Text:”Adedicatedsearchindexcreatedforyourdocument”– Feature badges:• “Fast retrieval” (lightning icon)• “Organized storage” (filing icon)• “Isolated & secure” (lock icon)↓ (Processing arrow)STEP 6: “AI Language Translation”LEFT SIDE:– Label: “Traditional Search”– Icon: Text with exact word matching– Example: “cat” matches “cat” only– Visual: Simple text matching with = sign– Text: “Keyword matching only”VS. (versus indicator in center)RIGHT SIDE:– Label: “AI-Powered Search”– Icon: Brain/neural network pattern– Example: “cat”matches”feline”,”kitten”,”pet”– Visual: Text transforming into glowing neural network vectors– Text: “Understands meaning & context”– Tech detail: “3,072-dimension understanding”BOTTOM EXPLANATION BOX:“Each section is converted into a unique ‘AI fingerprint’ that captures its meaning, enabling smart semantic search”—INFOGRAPHIC 5/6: “Question Answering – Step 7 + Chat Flow”TITLE: “Phase 4: Your Document Answers Questions”SUBTITLE: “Ask anything in natural language”VISUAL FLOW (Left-to-Right):STARTING POINT: “User Asks a Question”– Icon: Person with speech bubble– Example question: “What are the main findings about customer satisfaction?”– Visual: Chat interface mockup↓STEP 1: “Smart Search”– Icon: Magnifying glass with AI sparkles– Text: “AI finds the most relevant sections”-Visual:Searchbeamshighlightingspecificchunksintheindex-Badge:”Semanticsearch-understandscontext”↓STEP 2: “Context Assembly”– Icon: Puzzle pieces coming together-Text:”Relevantinformationgatheredfromacrossthedocument”– Visual: Multiple chunks (from different pages) assembling-Showpagenumbers:”Page3,Page7,Page12″↓STEP 3: “AI Generates Answer”-Icon:AIbrainwriting/generatingtext– Text: “Azure OpenAI creates a clear, accurate answer”– Visual: Answer being written with context sources↓FINAL OUTPUT: “Smart Answer Delivered”-Icon:Chatbubblewithcheckmark-Visual:Cleananswercardshowing:• “Answer: [example answer text]”• “Sources: Pages 3, 7, 12”• “Confidence: 94%”• “Language: Auto-detected”– Badge: “Includes page references for verification”BOTTOM FEATURE HIGHLIGHTS (Icon Row):• “Multi-language support” (globe icon)• “Source citations” (bookmark icon)• “Confidence scores” (meter icon)• “Instant responses” (lightning icon)—INFOGRAPHIC 6/6: “Technical Architecture”TITLE: “Powered by Microsoft Azure AI”SUBTITLE: “Enterprise-grade AI infrastructure”LAYOUT: Hub-and-spoke architectureCENTER: “Your PDF Document”(hubicon)SURROUNDING SERVICES (spokes with icons and descriptions):1. “Azure Document Intelligence”– Icon: Document with AI chip– Description: “Reads and understands document structure”– Badge: “99%+ accuracy”2. “Azure OpenAI”– Icon: Brain/neural network– Description: “Creates embeddings and generates answers”– Badge: “GPT-4 powered”3. “Azure AI Search”– Icon: Search database– Description: “Vector search with HNSW algorithm”– Badge: “Millisecond response”4. “FastAPI Backend”– Icon: Server/API– Description: “Orchestrates the entire pipeline”– Badge: “REST API”BOTTOM LAYER: “Security & Compliance”– Icon row: Shield, Lock, Checkmark-Text:”Enterprisesecurity•Dataprivacy•Scalableinfrastructure”STATS PANEL (Side or Bottom):– “3,072 dimensions” (embedding size)– “Sub-second search” (speed)– “Multi-language” (capability)– “Page-level tracking” (precision)—DESIGN SPECIFICATIONS:– Color palette: Blues, greens, purples (Microsoft Azure brand compatible)– Style: Modern, minimalist, professional– Icons: Simple, universally understood– Typography: Large, readable fonts for presentation slides– Arrows: Smooth, flowing connections between steps– Include subtle shadows or depth effects– Use 2-3 primary colors maximum per infographic– Number each as X/6 to show series progression
Conclusion
By combining code understanding, structured reasoning, and visual explanation, this workflow transforms slide creation into a systematic and scalable process.
Instead of struggling to explain complex code manually, you can let LLMs help uncover the logic and communicate it clearly.
This method is especially useful for:
– Algorithm explanations
– Machine learning models
– System design presentations
– Educational and internal knowledge sharing