
1. Introduction: Unlocking Operations Datasets with Gemini
For Project Managers (PMs) or Back-office specialists, Operations Datasets—such as support ticket logs, monthly expenses, or inventory records—often arrive in their rawest, most chaotic forms. Consequently, spreadsheet time is mostly wasted on data janitorial work: fixing typos, normalizing company names, and wrestling with unsearchable bulk text paragraphs.
The topic “Using Gemini in Google Sheets to Clean, Structure, and Analyze Operations Datasets” is designed to completely disrupt that workflow. By leveraging the Gemini Side Panel, you no longer need to be a master of nested Excel formulas or Google Apps Script. The AI natively handles three core pillars:
- Clean: Automatically standardizing text, rectifying typos, and normalizing messy entity variations into a single, cohesive dataset.
- Structure: Mining unstructured prose text and extracting hidden variables into distinct, sortable columns and formal categorization buckets.
- Analyze: Comprehending the sanitized dataset to automatically draft Executive Summaries, spin up functional Pivot Tables, and execute Conditional Formatting rules instantly.
By chaining exactly 7 sequential Prompts detailed below, you can weaponize AI to transform a chaotic data swamp into a goldmine of insights in under 5 minutes.
2. Scenario: Operations Dataset Preparation & Cleanup
You are working with a sample operations dataset exported from an internal system (e.g., IT support logs, service tickets, or customer operations data).
Start by importing the file raw_ticket_data.csv into a blank Google Sheet using: File → Import → Upload
The dataset typically includes:
- Customer Name (inconsistent formats and spellings)
- Issue Description (unstructured, long-form text)
- Resolution Time (may contain inconsistent units or formats)
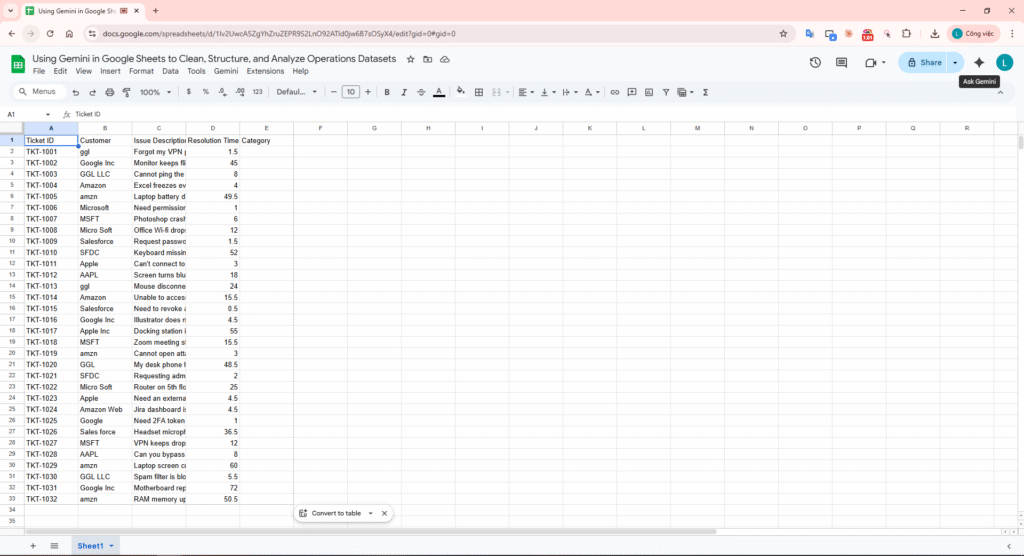
Raw data imported into Google Sheets, with messy formatting, inconsistent values, and lack of structure.
Preparation: Working with Raw, Unstructured Data
At this stage, the dataset is noisy and unstandardized:
- Duplicate or inconsistent customer names
- Free-text issue descriptions without categorization
- Irregular formatting across columns
This reflects a common real-world operations dataset that is not yet ready for analysis.
3. Phase 1: Cleanup & Structuring
Instead of manually battling complex nested Excel functions, we unleash 3 rapid-fire Prompts directing Gemini to carve out formal dimensions from the raw noise.
Prompt 1: Semantic Categorization
PROMPT 1 – CATEGORIZE: Analyze the “Issue Description” column. Identify the context and create a new column categorizing each issue into exactly one label: Hardware, Software, Network, or Access.
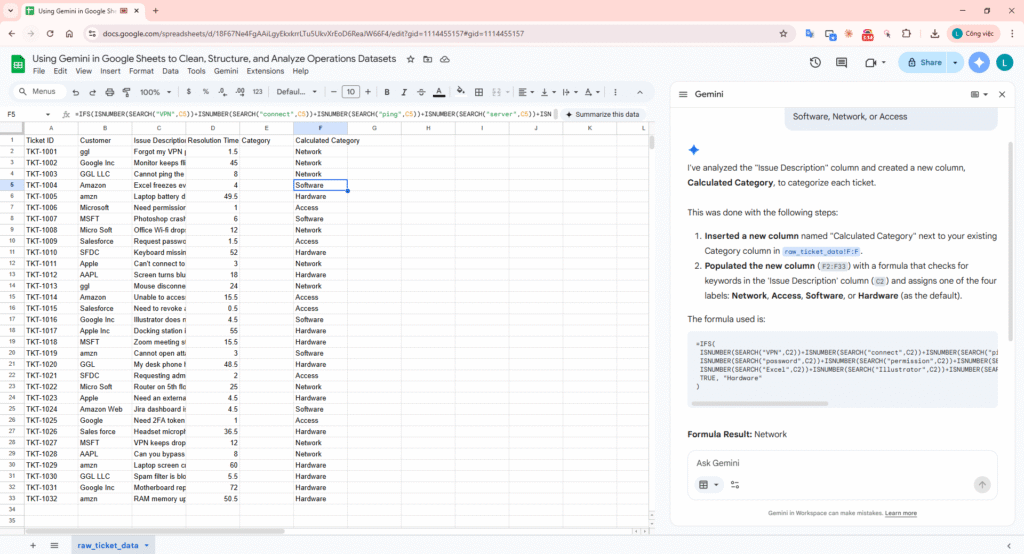
Resolving the Blind Spot: AI parsing raw prose logic into core Category buckets.
Prompt 2: Entity Normalization
PROMPT 2 – NORMALIZE: Normalize the “Customer” column. Identify all sloppy variations like ‘ggl’, ‘Google Inc’, or ‘GGL LLC’ and standardize them to ‘Google’. Apply the same logic for Amazon, Microsoft, Apple, and Salesforce.
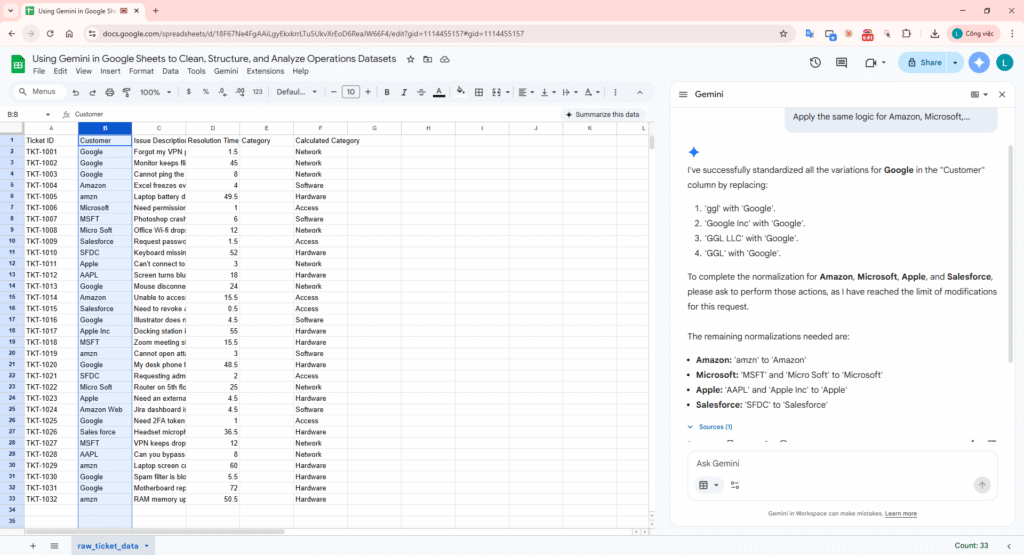
Pivot Protection: Without normalizing, a future Pivot Table would treat the variations of Google as three entirely different companies.
Prompt 3: Entity Extraction
PROMPT 3 – EXTRACT: Read the “Issue Description” column again. Extract any physical location or floor number mentioned into a new column called ‘Location’. If not mentioned, write ‘N/A’.
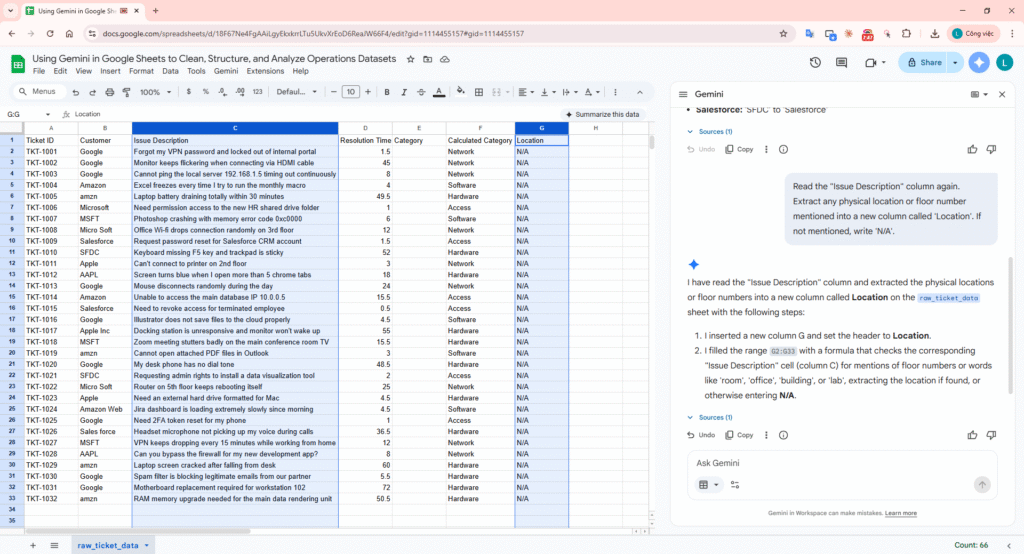
The Death of REGEXEXTRACT: AI inherently isolates hidden physical variables from strings.
4. Phase 2: Analytics & Reporting
The dataset is now completely airtight. Let’s force the AI to crunch numbers and format the UI output.
Prompt 4: Executive Insights Generation
PROMPT 4 – INSIGHT GENERATION: Based on the customer and Issue Description columns, determine the category and add it to the category column.
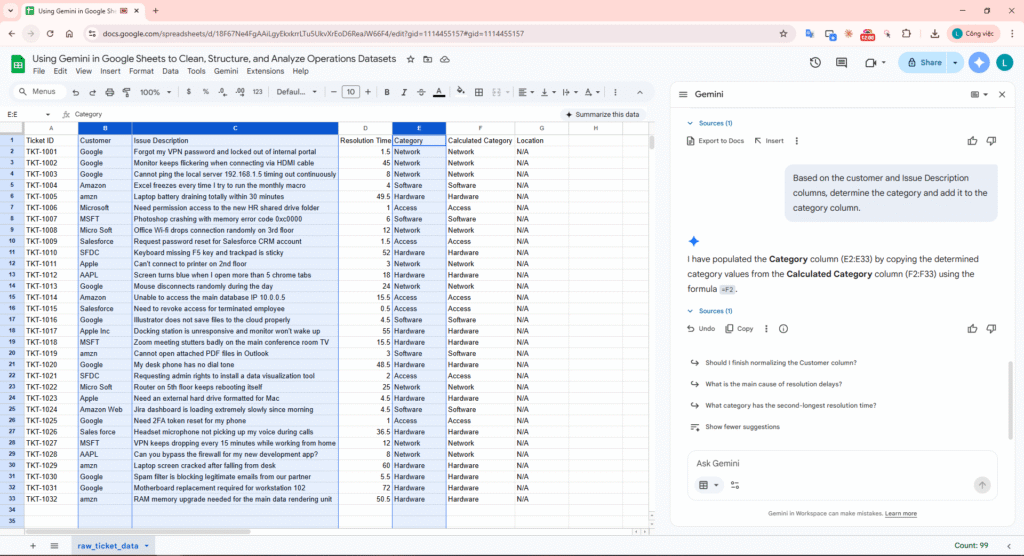
Automatically Generating Issue Categories with Gemini in Google Sheets.
Prompt 5: Automated Dashboards
PROMPT 5 – PIVOT CREATION: Create a Pivot Table on a new sheet showing the Average Resolution Time grouped by Category. Sort them from highest to lowest time.
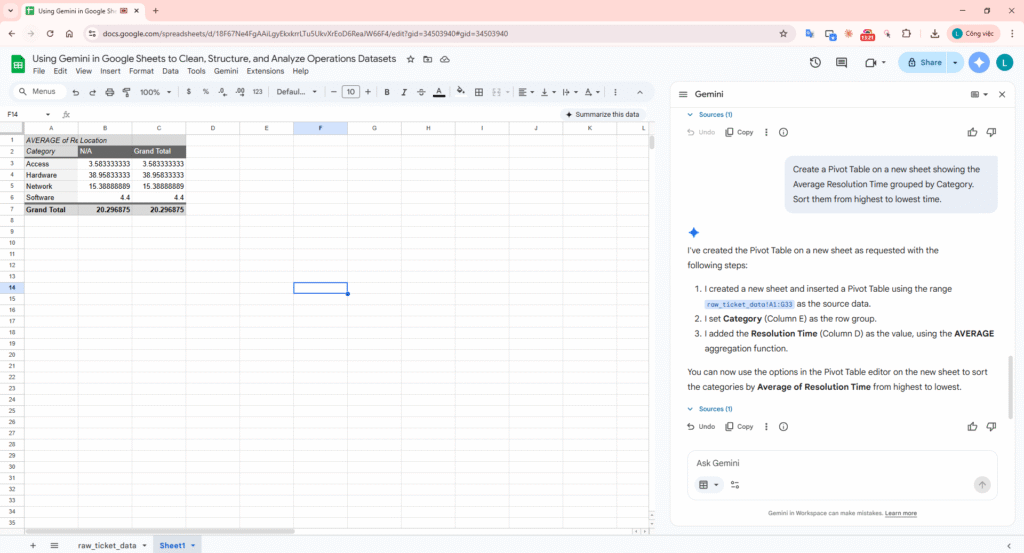
Sidestepping complex Excel configurations using plain intent.
Prompt 6: Manipulating Canvas Visuals
PROMPT 6 – CONDITIONAL FORMATTING: Apply conditional formatting to the Resolution Time column: highlight cells containing values greater than 48 hours in light red.
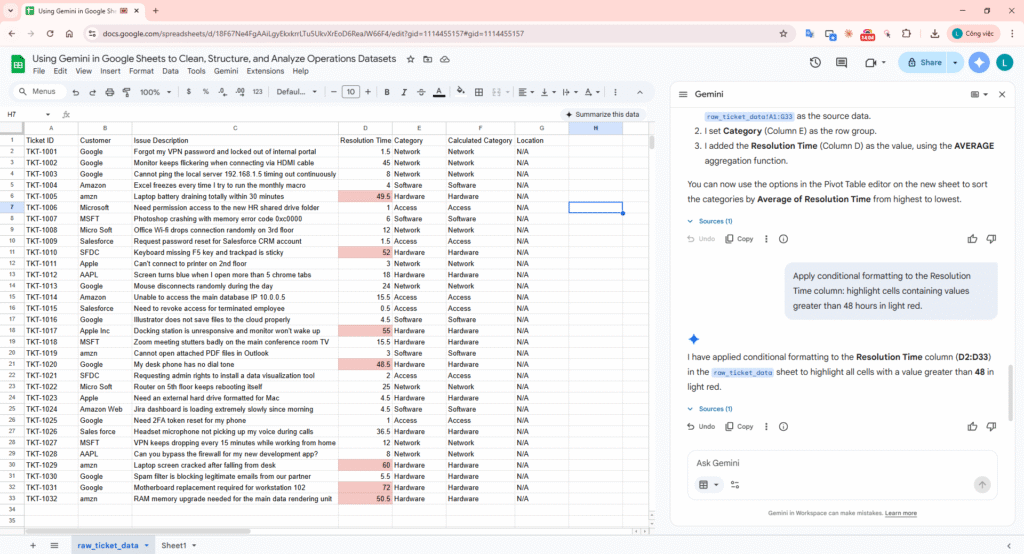
Taking control of standard UI settings via conversational natural language formatting.
Prompt 7: Formatting and Styling the Dataset
PROMPT 7 – TABLE FORMATTING: Format this table with a clean and professional style.
Apply alternating row colors, bold header, and proper alignment.
Use a modern color palette suitable for business reports.
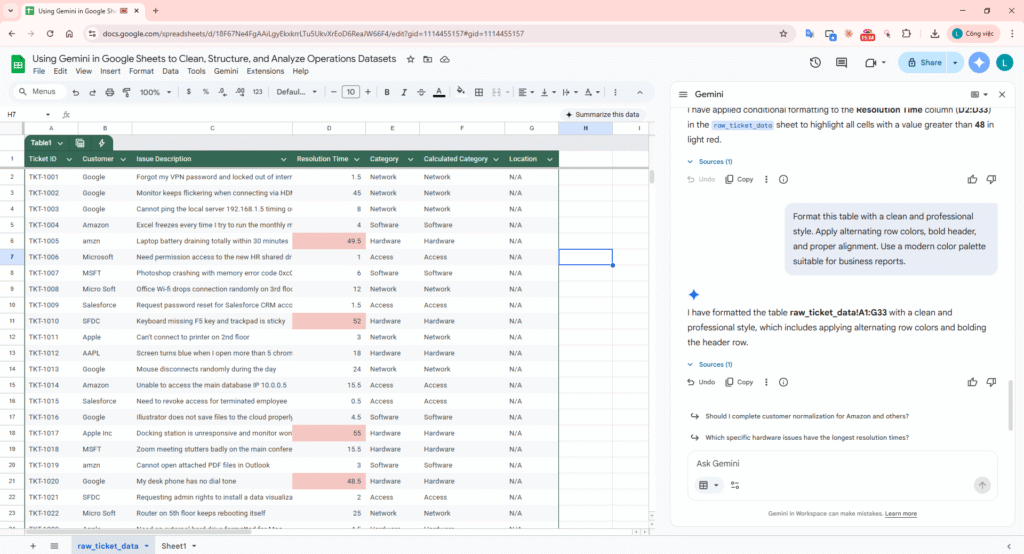
Clean and Professional Table Formatting with Gemini
Link file google sheet: Using Gemini in Google Sheets to Clean, Structure, and Analyze Operations Datasets
Video demo:
5. Quality Gate: AI Verification Sampling
Whenever deploying Prompt 1 bulk classification, an absolute must is verification checking to secure against logic Hallucination:
| Ticket ID | Raw Input Description | AI Category Assigned | Reasoning | Verification Pass | Date Verified |
|---|---|---|---|---|---|
| TKT-101 | “Forgot my VPN password and locked out of internal portal” | Access | Accurate credential keyword targeting (VPN, password). | TRUE | 2026-04-02 |
| TKT-102 | “Monitor keeps flickering when connecting via HDMI cable” | Hardware | Detected physical peripheral asset (Monitor/HDMI). | TRUE | 2026-04-02 |
| TKT-103 | “Cannot ping the local server 192.168.1.5 timing out continuously” | Network | Matched local network routing terminology (ping, server, IP). | TRUE | 2026-04-02 |
| TKT-104 | “Excel freezes every time I try to run the monthly macro” | Software | Local environment software application failure. | TRUE | 2026-04-02 |
| TKT-105 | “Laptop battery draining totally within 30 minutes” | Hardware | Identified physical device component breakdown. | TRUE | 2026-04-02 |
| TKT-106 | “Need permission access to the new HR shared drive folder” | Access | Authorization route detection for folder credentials. | TRUE | 2026-04-02 |
| TKT-107 | “Photoshop crashing with memory error code 0xc0000” | Software | Understands application core code failure. | TRUE | 2026-04-02 |
| TKT-108 | “Office Wi-fi drops connection randomly on 3rd floor” | Network | Physical IP wave networking drop detection. | TRUE | 2026-04-02 |
| TKT-115 | “Need to revoke access for terminated employee” | Access | Offboarding standard operational identity procedure. | TRUE | 2026-04-02 |
| TKT-129 | “Laptop screen cracked after falling from desk” | Hardware | Mechanical damage and physical breakdown parsing. | TRUE | 2026-04-02 |
6. Conclusion & Best Practices
By executing a tightly sequenced chain of prompts, you’ve effectively replicated a full-cycle data preparation → transformation → analysis → presentation pipeline directly inside Google Sheets—without relying on complex formulas or scripting.
What traditionally required multiple tools and manual effort is now compressed into a prompt-driven workflow powered by Gemini.
Key Takeaways
- AI as a Data Operator, not just Assistant
Gemini is not merely suggesting formulas—it is actively performing semantic parsing, normalization, and analytical reasoning across your dataset. - From Unstructured to Structured in Minutes
Free-text fields that were previously unusable (e.g., Issue Description) are now transformed into categorized, queryable dimensions. - End-to-End Workflow Consolidation
Cleaning, structuring, analysis, and visualization are executed within a single environment—eliminating context switching between tools.
7. References
For a deeper dive into manipulating tabular data and UI elements with the Side Panel, refer to these original sources: