Introduction
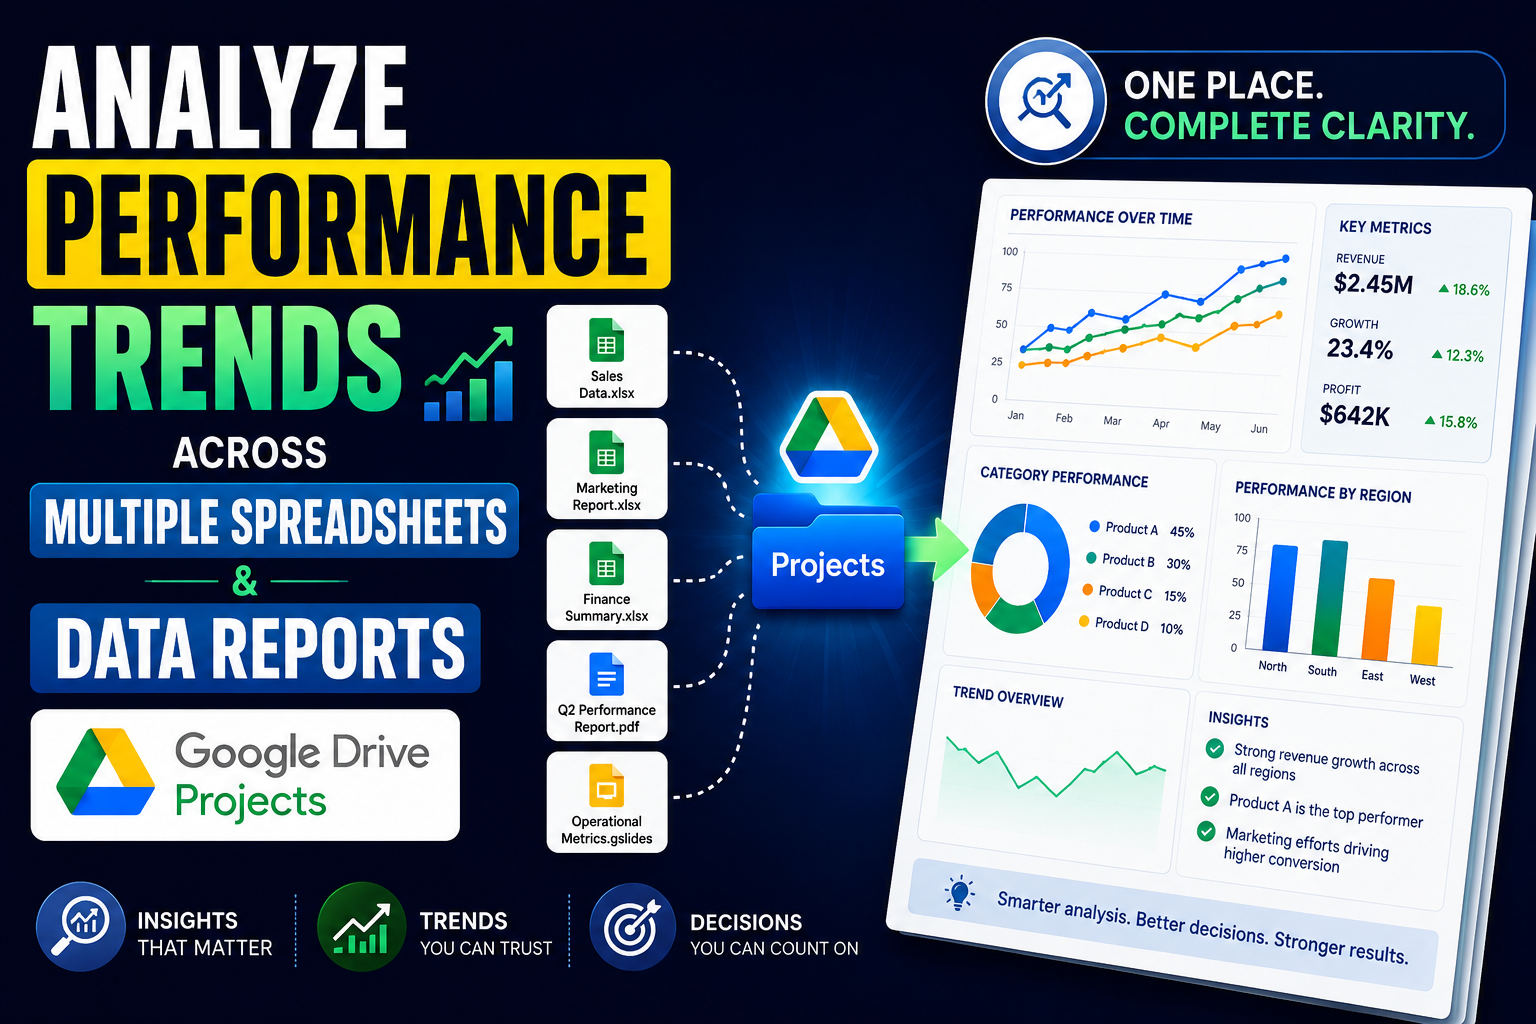
Google Drive Projects with Ask Gemini in Drive let you pin multiple Google Sheets and PDF reports (by quarter or period) as fixed sources, then ask cross-document analysis questions—extract metrics, compare trends over time, and produce structured findings.
Unlike opening files one by one and copying numbers manually, Projects keep original file locations, support citations, resume conversation history, and control scope by toggling sources.
Requirements & checklist
- Create a Google Drive Project and bundle multiple Sheets + PDF reports across operational periods.
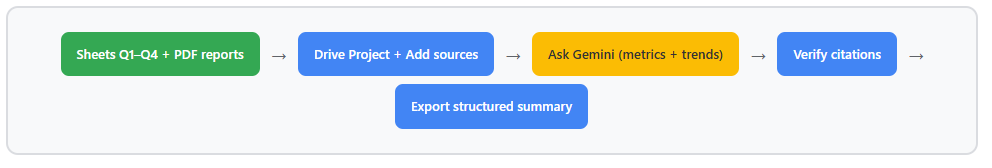
- Prompt Gemini: extract key performance metrics, compare trends over time, generate a structured summary.
- State a clear opinion on how cross-document retrieval streamlines periodic review tasks.
- Demo via video following Steps 1–16 plus folder/schema reproducibility guidance.
Business scenario & dummy data
Context: a PMO / Operations team prepares a 2025 performance review for leadership. Data is scattered across four quarterly Sheets plus H1 and full-year PDF summaries.
| Item | Sample value |
|---|---|
| Department | Operations / PMO |
| Sheets | OPS_Metrics_2025_Q1 … Q4 |
| PDFs | REPORT_H1_2025_Executive_Summary.pdf, REPORT_FY2025_Annual_Operations_Review.pdf |
| Drive Project | Performance Review — Operations 2025 |
| Sample metrics | Uptime, P1 incidents, MTTR, sprint completion, cloud spend, NPS |
| Output | REVIEW_2025_Ops_Performance_Summary |
Analysis workflow
Reproducibility
Folder tree
| Path | Role |
|---|---|
| WS_Ops_Performance_Review/00_Source_Data | Period Sheets + PDFs (master, read-only during analysis) |
| WS_Ops_Performance_Review/10_Review_Outputs | Exported summaries after Gemini |
Sheet schema (fixed across quarters)
| Column | Description |
|---|---|
| period | 2025-Q1 … Q4 |
| metric_category | Reliability, Incidents, Delivery, Cost, Customer |
| metric_name | Metric name |
| value | Numeric value |
| unit | percent, count, USD, … |
| notes | Qualitative notes (migration, target, …) |
Opinion: integrating into PMO/Operations workflows
Subjective assessment based on this demo—for teams running periodic reviews with data spread across Drive.
Why integrate
- Less manual consolidation: PMO often spends 2–4 hours per quarter copying from multiple Sheets and reading PDFs; one Project + one prompt cuts that to ~30–45 minutes for a structured draft.
- Consistent cross-period comparison: Gemini sees Q1–Q4 and PDF narrative together—reduces missed inflection points (e.g. Q3 migration).
- Traceability: citations and Sources used answer “where did this number come from?” in steering meetings.
- Reusable each period: clone the Project annually, swap source files, keep the prompt template.
Limits to control
- Gemini may round numbers or misread PDF text—require [VERIFY] tags and PMO sign-off.
- Low-quality scanned PDFs may OCR poorly—prefer text-native PDFs from Google Docs.
- Does not replace BI/real-time dashboards; best for periodic review narrative.
DEMO
Link Drive: WS_Ops_Performance_Review
Step 1 — Drive folder structure
- Open drive.google.com.
- Go to WS_Ops_Performance_Review.
- Confirm 00_Source_Data and 10_Review_Outputs exist.
Step 2 — Q1 metrics sheet
- In 00_Source_Data, open OPS_Metrics_2025_Q1.
- Verify headers: period, metric_category, metric_name, value, unit, notes.
- Confirm Q1 data (e.g. uptime 99.42%, P1 incidents = 4).
Step 3 — Q2 metrics sheet
- Open OPS_Metrics_2025_Q2.
- Compare with Q1: lower P1 incidents (2 vs 4), higher uptime (99.58%).
Step 4 — Q3 metrics sheet
- Open OPS_Metrics_2025_Q3.
- Note uptime dip (99.31%) and migration notes in
notes.
Step 5 — Q4 metrics sheet
- Open OPS_Metrics_2025_Q4.
- Confirm recovery: uptime 99.61%, NPS 46, sprint completion 93%.
Step 6 — PDF report
- Open REPORT_H1_2025_Executive_Summary.pdf or REPORT_FY2025_Annual_Operations_Review.pdf.
- Read narrative sections (Key highlights / Quarter-over-quarter) for context beyond Sheets.
Step 7 — Create Drive Project
- On Drive, click New → Project (or open project.new).
Step 8 — Name the Project
- Enter name: Performance Review — Operations 2025.
- Click Create Project.
Step 9 — Add sources
- In the Project, click Add sources.
- Select 6 files from 00_Source_Data: OPS_Metrics_2025_Q1 …
Q4, REPORT_H1_2025_Executive_Summary.pdf, REPORT_FY2025_Annual_Operations_Review.pdf.
Step 10 — Confirm sources list
- Verify Sources / Sources used panel shows all 6 files.
- Keep all checkboxes enabled before asking Gemini.
Step 11 — Open Ask Gemini
- Inside the Project, open Ask Gemini.
- Confirm 6 sources are active and the prompt box is empty.
Step 12 — Enter trend analysis prompt
Paste this prompt into Ask Gemini and send:
You are an operations analyst helping our PMO team prepare a quarterly performance review.

Use ONLY the pinned project sources (Q1–Q4 Google Sheets and the H1 / FY PDF reports).

Tasks:
1) Extract key performance metrics by category: Reliability, Incidents, Delivery, Cost, Customer.
2) Compare trends quarter-over-quarter for 2025 (Q1 → Q4): direction (up/down/stable), notable inflection points.
3) Cross-check Sheet numbers with qualitative statements in the PDF reports (flag any mismatch with [VERIFY]).
4) Output a structured summary with these sections:
   - Executive snapshot (5 bullets)
   - Metric table (metric name | Q1 | Q2 | Q3 | Q4 | trend)
   - Top 3 improvements
   - Top 3 risks or regressions
   - Recommended actions for next quarter

Tone: concise, data-driven, suitable for a department steering meeting.
Use citations where possible.
Step 13 — Review analysis output
- Wait for Gemini to respond.
- Check for: Executive snapshot, Q1–Q4 metric table, top improvements/risks, recommended actions.
- Note citations [1], [2]… if present.
Step 14 — Verify data sources
- In Sources used, click a file name (e.g. OPS_Metrics_2025_Q3) to open the Sheet.
- Or click citation [1], [2] in the response.
- Reconcile Sheet numbers with PDF narrative; flag items needing [VERIFY].
Do not Export yet — export is Step 15.
Step 15 — Export structured summary
- Scroll to the bottom of Gemini’s response.
- Click Export to Docs (or Word depending on tenant) — not Export to Sheets for the full summary.
- Save to 10_Review_Outputs as REVIEW_2025_Ops_Performance_Summary.
Step 16 — Project history
- Drive sidebar → Projects → select your project.
- Open History → see the trends conversation (resume research).
Failure-prone points (3+)
| Risk | Observation | Mitigation |
|---|---|---|
| Inconsistent Sheet schema | Renamed columns in Q3 break trends. | Sheet template + validate before adding sources. |
| Unreadable PDF | Blurry scan → Gemini skips narrative. | Use text PDFs from Google Docs. |
| Hallucinated metrics | Numbers not in Sheets appear in summary. | Require citations; PMO verifies each table row. |
| Drive permissions | Collaborator lacks View on Sheet/PDF. | Share 00_Source_Data with PMO group. |
Conclusion
Drive Projects turn quarterly Sheets and PDFs into one analysis workspace: extract metrics, compare trends, and summarize findings with source verification. This is a practical approach for periodic operational review—especially PMO/Operations teams that still consolidate manually before steering meetings. Combined with the Step 1–16 demo video, teams can onboard and repeat the process each quarter or year.