
Automate Google Slides Generation from Google Sheets using Apps Script (With Charts!)
As developers and project managers, we’ve all been there: it’s the end of the month, and you are stuck manually copy-pasting data from a spreadsheet into dozens of presentation slides. It’s tedious, time-consuming, and highly prone to human error.
In this tutorial, I’ll show you how to completely automate this workflow using Google Apps Script. We will read data from Google Sheets, duplicate a company slide template, replace text placeholders, and even insert a dynamic chart for over 10 employees—all with a single click.
I. The Reproducible Setup (Folder & IDs)
To keep things organized, let’s set up a clean workspace in Google Drive:
- Create a root folder named Demo Auto Slides.
- Inside it, create an empty subfolder named Output files(This is where our generated reports will live). Grab the Folder ID from the URL.
- Create a Sample Sheets file (our data source) and a Google Slides file (our template) inside the root folder.
II. The Data Source (Google Sheets)
I will use an Agile/Scrum task management dataset. Create a sheet named Data and paste the following 10 rows of mock data:
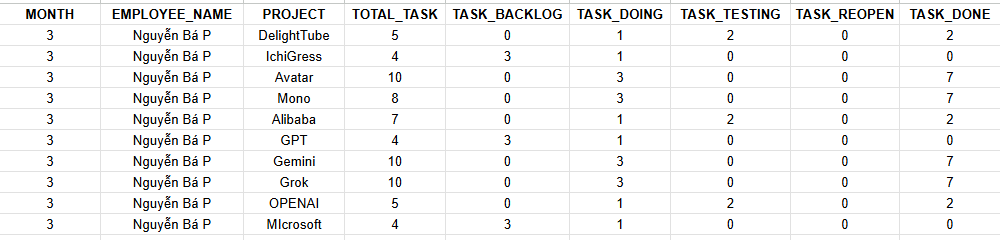
(Crucial step: Highlight some of this data and insert a Chart directly into this Google Sheet. Our script will programmatically fetch this exact chart and embed it into the slides).
III. The Company Template (Google Slides)
Open your Google Slides file and design a simple 2-page dashboard:
- Slide 1 (Executive Summary): Add text boxes with exact placeholders like {{MONTH}}, {{EMPLOYEE_NAME}}
- Slide 2 (Performance Metrics): Add text boxes with exact placeholders like {{PROJECT}}, {{TOTAL_TASK}}, {TASK_BACKLOG}}, {{TASK_DOING}}, {{TASK_TESTING}}, {{TASK_REOPEN}}, {{TASK_DONE}}
Leave a large blank space on the right side. This will act as our chart placeholder.
Grab the File ID of this template from its URL.
IV. The Core Logic (Apps Script Code)
const CONFIG = {
  TEMPLATE_ID: '1mTYe3pXz87C74xHVJfsCIiLZrqzdnvbgRBzmgZSePU4',
  OUTPUT_FOLDER_ID: '1LE0bbjjcSU2QKzc_mU2p03NVX8-EzehO',
  SHEET_NAME: 'Data'
};

function generateBulkSlides() {
  const ss = SpreadsheetApp.getActiveSpreadsheet();
  const sheet = ss.getSheetByName(CONFIG.SHEET_NAME);

  const dataRange = sheet.getDataRange();
  const data = dataRange.getValues();
  data.shift();

  const outputFolder = DriveApp.getFolderById(CONFIG.OUTPUT_FOLDER_ID);
  const templateFile = DriveApp.getFileById(CONFIG.TEMPLATE_ID);

  let tempSheet = ss.getSheetByName("TEMP_CHART");
  if (!tempSheet) {
    tempSheet = ss.insertSheet("TEMP_CHART");
  }

  data.forEach((row, index) => {
    if (!row[0]) return;

    const presentationName = `Report_${row[1]}_${new Date().toISOString().split('T')[0]}`;

    const newFile = templateFile.makeCopy(presentationName, outputFolder);
    const slideDeck = SlidesApp.openById(newFile.getId());

    let safeMonth = 'N/A';
    if (row[0]) {
      if (row[0] instanceof Date) {
        safeMonth = Utilities.formatDate(row[0], Session.getScriptTimeZone(), "MM/yyyy");
      } else {
        safeMonth = row[0].toString();
      }
    }

    const mapData = {
      '{{MONTH}}': safeMonth,
      '{{EMPLOYEE_NAME}}': row[1] || 'Unknown',
      '{{PROJECT}}': row[2] || 'Unassigned,
      '{{TOTAL_TASK}}': row[3] || '0',
      '{{TASK_BACKLOG}}': row[4] || '0',
      '{{TASK_DOING}}': row[5] || '0',
      '{{TASK_TESTING}}': row[6] || '0',
      '{{TASK_REOPEN}}': row[7] || '0',
      '{{TASK_DONE}}': row[8] || '0'
    };

    for (const [placeholder, value] of Object.entries(mapData)) {
      slideDeck.replaceAllText(placeholder, value.toString());
    }

    tempSheet.clear();

    const chartData = [
      ["Task", "Count"],
      ["Backlog", row[4] || 0],
      ["Doing", row[5] || 0],
      ["Testing", row[6] || 0],
      ["Reopen", row[7] || 0],
      ["Done", row[8] || 0],
    ];

    tempSheet.getRange(1, 1, chartData.length, 2).setValues(chartData);

    const chartBuilder = tempSheet.newChart()
      .setChartType(Charts.ChartType.COLUMN)
      .addRange(tempSheet.getRange("A1:B6"))
      .setOption('title', `Task Metrics - ${row[2]}`)
      .setOption('legend', { position: 'none' })
      .setPosition(1, 1, 0, 0)
      .build();

    tempSheet.insertChart(chartBuilder);

    const tempCharts = tempSheet.getCharts();
    const currentChart = tempCharts[tempCharts.length - 1];

    const slides = slideDeck.getSlides();
    if (slides.length >= 2) {
      const targetSlide = slides[1];

      targetSlide.insertImage(
        currentChart.getBlob(),
        250, 50, 450, 300
      );
    }

    tempSheet.removeChart(currentChart);

    slideDeck.saveAndClose();
    Logger.log(`Đã tạo thành công: ${presentationName}`);
  });
}
V. Under the Hood: How It Works
If you are curious about the technical design, here is a breakdown of the three core mechanics:
1. Placeholder Naming Rules
Why use {{EMPLOYEE_NAME}} instead of just Employee name? Using double curly braces is a templating best practice. It creates a highly unique string, ensuring that the function doesn’t accidentally overwrite regular text in your slides that might share the same words.
2. Data Mapping Design
The getValues() method returns a 2D Array. We remove the header row using data.shift(). Inside our forEach loop, each row represents an employee’s data. We map the array indices (e.g. row[1]) to their corresponding presentation keys ({{EMPLOYEE_NAME}}) using the mapData object. This keeps the code clean and highly scalable if we add more columns later.
3. Missing Data Handling
Real-world data is rarely perfect. What if an employee hasn’t been assigned a project yet? Instead of crashing or printing undefined, we use the JavaScript Logical OR (||) operator: ‘{{PROJECT}}’: row[2] || ‘Unassigned’. This guarantees a clean fallback.
VI. The Final Output
Hit Run, authorize the script, and check your Output files folder. You will see 10 brand-new, customized presentation files generated in seconds!
Open any of those files, and you’ll see the text placeholders are perfectly replaced. Even better, the chart from your Google Sheet has been dynamically inserted into the second slide!
Video demo: https://youtu.be/tosnzvVWMcc
Conclusion
With just a few lines of JavaScript, you can turn hours of mind-numbing reporting into a 10-second background task. Automation like this not only scales your operations but also makes you look like a wizard to your stakeholders.
Have ideas on how to extend this script (e.g., auto-exporting to PDF and emailing the team)? Let me know in the comments below!
References:
Generate Google Slides from Google Sheets
Automate Google Slides Creation Using ChatGPT & Google Apps Script