1. DEMO SCENARIO OVERVIEW
Organization: Internal Operations / Marketing team (fictional demo)
Initiative: Quarterly business activity review & onboarding for analysts
Goal: One Drive Project locks all period-based sources so Gemini can
compare Q1 vs Q2 vs Q3, summarize PDF executive reports, and
answer onboarding questions without searching all of Drive.
Why Sheets + PDF together:
- Google Sheets = structured numbers (KPIs, campaigns, spend, leads)
- PDF reports = narrative summary, charts exported from slides, signed-off
quarterly reviews from leadership
Project name (recommended): Quarterly Activity Hub — Demo
2. FOLDER STRUCTURE ON GOOGLE DRIVE
Create one parent folder, then subfolders by year and type:
Quarterly Activity Demo/
├── 2025/
│ ├── Sheets/
│ │ ├── Q1_2025_Activity_Data.xlsx → use Google Sheets format
│ │ ├── Q2_2025_Activity_Data.gsheet
│ │ ├── Q3_2025_Activity_Data.gsheet
│ │ └── Q4_2025_Activity_Data.gsheet
│ └── PDF_Reports/
│ ├── Q1_2025_Executive_Summary.pdf
│ ├── Q2_2025_Executive_Summary.pdf
│ ├── Q3_2025_Executive_Summary.pdf
│ └── Q4_2025_Executive_Summary.pdf
└── README_Period_Definitions.gdoc (optional: period labels, fiscal calendar)
NOTE: In Drive, prefer native Google Sheets (.gsheet) not only .xlsx so Gemini
reads live sheet data reliably. Upload PDFs as PDF or export from Docs.
3. DEMO FILE INVENTORY (8 SOURCES + 1 OPTIONAL)
Add to Drive Project — minimum 8 files (4 Sheets + 4 PDFs):
| # | File name | Type | Period | Role in Project |
|---|---|---|---|---|
| 1 | Q1_2025_Activity_Data | Sheet | Q1 2025 | Raw KPIs Jan–Mar |
| 2 | Q2_2025_Activity_Data | Sheet | Q2 2025 | Raw KPIs Apr–Jun |
| 3 | Q3_2025_Activity_Data | Sheet | Q3 2025 | Raw KPIs Jul–Sep |
| 4 | Q4_2025_Activity_Data | Sheet | Q4 2025 | Raw KPIs Oct–Dec |
| 5 | Q1_2025_Executive_Summary | Q1 2025 | Narrative + highlights | |
| 6 | Q2_2025_Executive_Summary | Q2 2025 | Narrative + highlights | |
| 7 | Q3_2025_Executive_Summary | Q3 2025 | Narrative + highlights | |
| 8 | Q4_2025_Executive_Summary | Q4 2025 | Narrative + highlights | |
| 9 | README_Period_Definitions | Doc | All | Optional: fiscal quarter dates |
4. GOOGLE SHEETS — DETAILED SAMPLE CONTENT (COPY INTO EACH QUARTER)
Use the SAME tab structure in every quarterly Sheet so Gemini can compare periods.
— Tab 1: Summary_KPIs (one row per metric) —
| Metric | Value | Unit | vs_Prior_Quarter | Notes |
|---|---|---|---|---|
| Total_Leads | (fill) | count | % or N/A for Q1 | Inbound + outbound |
| Qualified_Leads | (fill) | count | % | MQL definition in README |
| Conversion_Rate | (fill) | % | pp change | Qualified / Total |
| Campaign_Count | (fill) | count | delta | Active campaigns ended |
| Marketing_Spend_USD | (fill) | USD | % | Paid media + tools |
| Cost_Per_Lead | (fill) | USD | % | Spend / Total_Leads |
| Web_Sessions | (fill) | count | % | GA aggregate |
| Support_Tickets | (fill) | count | % | Ops load indicator |
SAMPLE VALUES FOR DEMO (paste per quarter):
Q1_2025_Activity_Data — Summary_KPIs:
Total_Leads: 1240 | Qualified: 310 | Conversion: 25.0% | Campaigns: 8
Spend: 48500 | CPL: 39.11 | Sessions: 89200 | Tickets: 412 | vs_PQ: N/A
Q2_2025_Activity_Data — Summary_KPIs:
Total_Leads: 1580 | Qualified: 426 | Conversion: 27.0% | Campaigns: 11
Spend: 55200 | CPL: 34.94 | Sessions: 104500 | Tickets: 389 | vs_PQ: +27% leads
Q3_2025_Activity_Data — Summary_KPIs:
Total_Leads: 1410 | Qualified: 366 | Conversion: 26.0% | Campaigns: 9
Spend: 51800 | CPL: 36.74 | Sessions: 97800 | Tickets: 445 | vs_PQ: -11% leads
Q4_2025_Activity_Data — Summary_KPIs:
Total_Leads: 1820 | Qualified: 510 | Conversion: 28.0% | Campaigns: 12
Spend: 61000 | CPL: 33.52 | Sessions: 118200 | Tickets: 401 | vs_PQ: +29% leads
— Tab 2: Campaigns_Detail (multiple rows) —
Columns: Campaign_ID | Name | Channel | Start_Date | End_Date | Spend_USD | Leads | Status
Include 3–5 rows per quarter (e.g. Q1: “Spring_Launch_Email”, “Paid_Search_Brand”, …).
Keep campaign names unique across quarters where possible for cross-period questions.
— Tab 3: Monthly_Breakdown —
Columns: Month | Leads | Spend_USD | Sessions
Three rows per sheet (months in that quarter only).
5. PDF REPORTS — DETAILED CONTENT OUTLINE
Each PDF: 2–3 pages max. Same section headings every quarter.
Q1_2025_Executive_Summary.pdf — suggested text blocks:
• Title: Q1 2025 Activity Executive Summary
• Overview: Lead growth driven by email nurture; spend within plan.
• Top wins: Spring Launch (+18% MQL), brand search CPC down 12%.
• Risks: Support ticket volume up vs Q4 2024; delayed Q2 product launch noted.
• Key number callouts: 1,240 leads, $48.5K spend, 25% conversion (match Sheet Q1).
• Next quarter focus: Expand paid social tests; hire 1 analyst.
Q2_2025_Executive_Summary.pdf:
• Strongest quarter for lead volume (+27% vs Q1).
• Highlight: 11 campaigns; Paid Social Pilot exceeded target by 15%.
• Risk: Ticket backlog reduced but CSAT dipped 2 points.
• Numbers: 1,580 leads, $55.2K spend, 27% conversion.
Q3_2025_Executive_Summary.pdf:
• Soft quarter: leads -11% vs Q2; attributed to summer seasonality in PDF narrative.
• Win: Cost per lead improved vs Q2 despite lower volume.
• Action: Paused 2 underperforming campaigns mid-quarter.
• Numbers: 1,410 leads, $51.8K spend, 26% conversion.
Q4_2025_Executive_Summary.pdf:
• Record leads (1,820); year-end promo + holiday campaign.
• Executive note: Recommend increasing Q1 2026 budget cap by 10%.
• Numbers: 1,820 leads, $61.0K spend, 28% conversion.
CRITICAL FOR GEMINI TEST: Numbers in PDF must match Summary_KPIs in the Sheet for
the same quarter — otherwise citations will look inconsistent in the article demo.
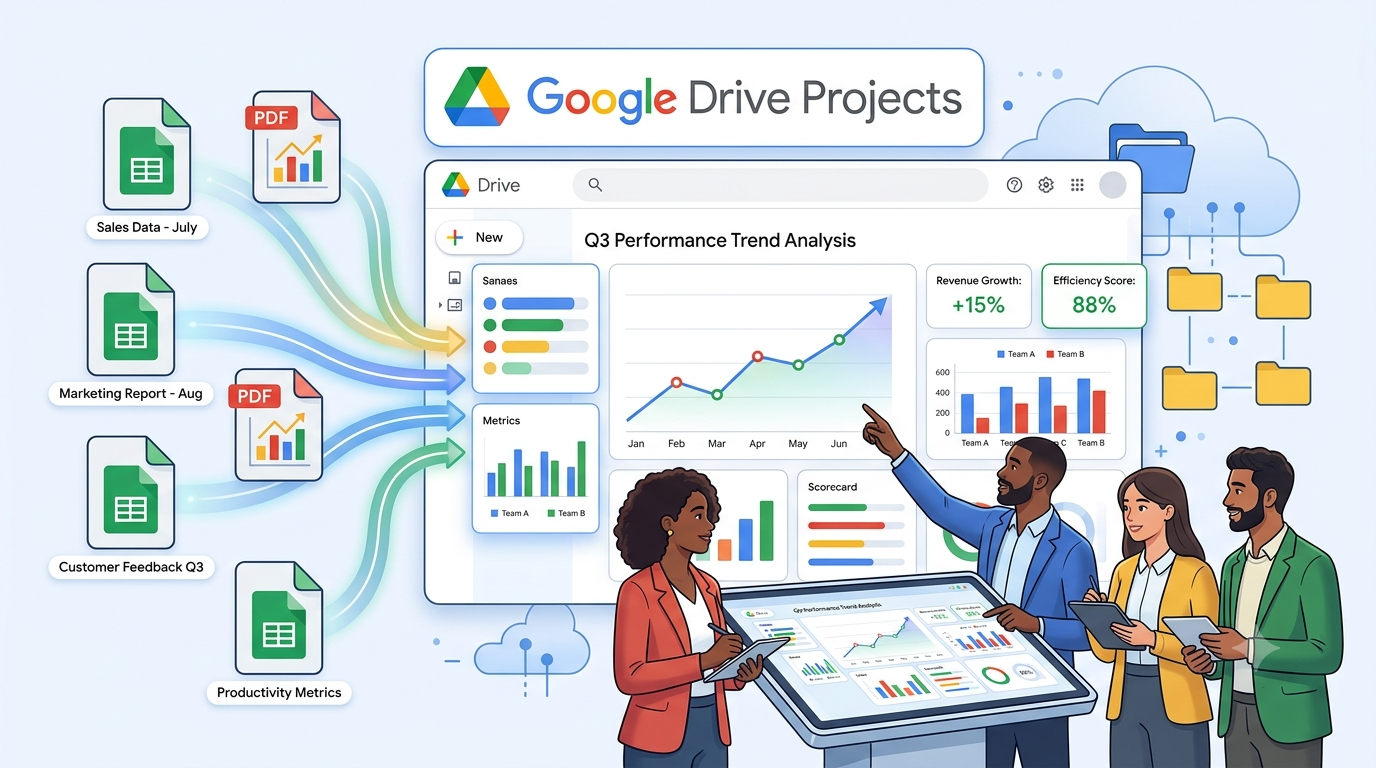
6. CREATE THE DRIVE PROJECT (HANDS-ON STEPS)
Step 1 — Upload / create all files under “Quarterly Activity Demo/2025/”
Step 2 — Permissions
• Share folder (or each file) with test accounts: at least Viewer
• Collaborators need eligible Gemini in Drive plan to use the Project
Step 3 — New Project
• https://drive.google.com → New → New Project
• Name: Quarterly Activity Hub — Demo
Step 4 — Add sources (bulk)
• Add entire folder “2025/Sheets” + “2025/PDF_Reports” OR add 8 files individually
• Optional: add README_Period_Definitions.gdoc
• Tip: Turn OFF broad Drive/Gmail/Web search when testing period-specific answers
Step 5 — Save & share Project
• Editor: project owner / lead analyst
• Viewer: new team members doing onboarding
7. GEMINI Q&A — PLANNED TEST QUESTIONS
Use these after sources are locked. Record answers + citations in the article.
Cross-quarter / Sheets-focused:
A. “Which quarter had the highest total leads in 2025? Show the number and source.”
B. “Compare marketing spend and cost per lead for Q2 vs Q3 2025.”
C. “List all campaigns in Q4 Sheet with spend over $5,000.”
D. “What was the conversion rate trend from Q1 through Q4?”
PDF + Sheet combined:
E. “According to Q3 PDF and Q3 Sheet, why did leads drop vs Q2?”
F. “Does Q4 PDF ‘record leads’ claim match Q4 Sheet Summary_KPIs? Cite both.”
G. “Summarize top risks mentioned across all four quarterly PDF reports.”
Onboarding-style:
H. “I’m new on the team — which files hold raw numbers vs executive narrative?”
I. “What metrics are tracked every quarter in the Sheets?”
Expected behavior:
• Correct: cites specific Sheet tab or PDF page/section
• Incorrect flags: mismatched numbers between PDF and Sheet for same quarter
• If answer uses data outside the 8 files → widen search was left ON (retest)
8. DEMO RESULTS TABLE (FILL AFTER YOU RUN GEMINI)
| # | Question ID | Result (Correct / Partial / Wrong) | Citations OK? | Notes |
|---|---|---|---|---|
| 1 | A | |||
| 2 | B | |||
| 3 | C | |||
| 4 | D | |||
| 5 | E | |||
| 6 | F | |||
| 7 | G | |||
| 8 | H |
Overall assessment (write after testing):
• Cross-period comparison accuracy:
• PDF vs Sheet consistency detection:
• Suitable for analyst onboarding? Yes / No — why:
9. ORIGINAL DEPARTMENT IDEA
“Period-Locked Analytics Project”
• One Drive Project per fiscal year (e.g. 2025 Activity Hub)
• At quarter close: add 1 Sheet + 1 PDF only — do not scatter new files in Drive root
• Analysts ask Gemini for QoQ comparisons instead of rebuilding slides manually
• Reduces 4–8 hours/quarter of copy-paste across decks for leadership readouts
10. CHECKLIST — DEMO READY?
[ ] Parent folder created on Drive
[ ] 4 Google Sheets with 3 tabs each + sample data aligned across quarters
[ ] 4 PDFs exported with narratives matching Sheet KPIs
[ ] Drive Project created and all 8 sources added
[ ] Broad search disabled for first test pass
[ ] At least 3 Gemini questions run (A, E, F recommended minimum)
[ ] Results table (Section 8) filled for article draft
[ ] Screenshots optional: Project source list, Gemini answer with citations
11. Practical evaluation — Gemini in real sales & reporting
Purpose of this section
Section 7 explains cross-file synthesis as a capability. This section is our real-world
evaluation of whether Gemini in Drive Projects is actually useful for everyday sales and
reporting — based on hands-on tests in Quarterly Activity Hub — Demo (not theory only).
What we tested in practice
- Real Project with 8 sources (4 Sheets + 4 PDFs for 2025).
- Three business questions a sales or reporting teammate would ask:
- “Analytic data for Q1” (single-period drill-down)
- “Analytics for Q4” (peak-period review)
- “Present the most successful quarter” (full-year comparison)
- Same conditions we use at work: locked sources, citations checked against files, Gemini
license required for collaborators (see Section 5).
Evaluation of Gemini in real use (from our demos)
| Real question (demo) | What Gemini did in practice | Efficiency in real work | Accuracy in real work | Practical verdict |
|---|---|---|---|---|
| Analytic data for Q1 | Returned KPIs, campaign table, monthly trend in one answer | Replaced opening 2+ files before a stand-up | Numbers matched Q1 Sheet; citations present | Strong for daily lookups |
| Analytics for Q4 | Summarized peak quarter + top campaigns + monthly rows | Faster than rebuilding a Q4 one-pager from scratch | Aligned with Q4 Sheet/PDF (+29% vs Q3) | Strong for quarter reviews |
| Most successful quarter | Built Q1–Q4 comparison table; named Q4 as peak | Saved an estimated 30–60 min vs manual QoQ sheet | All four quarters cited; KPIs consistent | Strong for leadership asks |
What works well in real sales & reporting routines
- Natural-language questions: Non-technical sales/reporting staff do not need pivot formulas
or VLOOKUP across files — they ask in plain English inside the Project. - Cross-file synthesis in practice: Demo 3 proved Gemini can merge four quarterly Sheets
into one comparison table — the main reporting pain point we wanted to fix. - Citations in real review: Clicking [1], [2] let us verify leads, CPL, and campaign spend
before reusing text in Slack or slides — similar to how we audit a junior analyst’s draft. - Speed for ad-hoc requests: Leadership questions during meetings got a first answer in minutes;
a human still validated, but the “data gathering” step shrank sharply. - Onboarding new hires: “Analytic data for Q1” worked as a self-serve intro to where numbers
live — useful when mentors are not available same day.
What does not work well (honest limits in real use)
- Not a substitute for sign-off: We still export verified tables to Slides/PDF for executives
and customers — Gemini output is a draft, not an approved report. - License and access friction: Teammates without Gemini in Drive cannot use the Project the
same way; we must share raw Sheets/PDFs in parallel (real rollout constraint). - Data hygiene is on us: If PDF and Sheet numbers diverge, Gemini may still sound confident —
we must keep sources aligned each quarter (operational discipline, not automatic). - Broad search off vs on: With wide search enabled, answers can drift outside the 8 files —
we turn it off for audits so results stay tied to our official quarterly pack. - Complex modeling: Gemini answered descriptive analytics well; we would not rely on it alone
for forecasting models or custom SQL — those stay in our BI tools.
Efficiency — how cross-file synthesis helps in real processes
Cross-file synthesis is the feature that makes Gemini practical here: one prompt spans
Sheets + PDFs + multiple quarters.
| Routine process | Real task | Before Gemini | After Gemini (our experience) |
|---|---|---|---|
| Sales — QBR prep | Best quarter & top campaigns | Manual 8-file compare | Demo 3 → draft table in minutes |
| Sales — benchmarks | Last quarter CPL / conversion | Hunt old decks | Demos 1–2 inside Project |
| Reporting — quarter close | Roll up 4 quarters | 4–8 hours copy-paste | Synthesis + citation review |
| Reporting — ad-hoc | “Why did Q3 dip?” | Analyst reconciles alone | Cross-source answer same day |
Estimated impact on our team: 4–8 hours saved per quarter close; 20–60 minutes saved per
ad-hoc QoQ question — enough to justify maintaining the Project, not enough to remove
analyst roles.
Accuracy — how cross-file synthesis helps in real processes
- Wrong-file risk drops when everyone uses one Project master list for the fiscal year.
- Citations create an audit trail sales and reporting managers already expect.
- Sheet + PDF together help catch narrative vs number gaps before external distribution.
- Human verification remains mandatory — Gemini improved first-draft quality, not final truth.
When we use Gemini vs when we do not (real policy)
USE Gemini in the Project for:
• Internal QoQ summaries, campaign comparisons, onboarding data tours
• Draft tables and talking points before leadership meetings
• Quick “what happened in Qx?” during sales stand-ups
DO NOT rely on Gemini alone for:
• Customer contracts, pricing, or legally binding figures
• Published board packs without opening every cited source
• Teams missing Gemini license or file access
Overall practical evaluation (our team)
Gemini in a Drive Project is production-ready for our internal sales and reporting
workflows when sources are locked, curated, and cited answers are reviewed. Cross-file
synthesis is the feature that delivers real value — without it, Gemini would feel like
a single-file summarizer; with it, the tool matches how we actually store quarterly data
(Sheets + PDF, multiple periods).
Rating for internal use (1–5, our team):
• Ease of use in Drive: 4/5 (needs Gemini license + Project setup once)
• Usefulness for sales routines: 4/5 (strong for benchmarks & QBR prep)
• Usefulness for reporting routines: 5/5 (largest time save at quarter close)
• Trust after citation check: 4/5 (good if sources stay aligned)
• Recommendation: Adopt Quarterly Activity Hub pattern for 2026; keep human sign-off.
This evaluation is specific to our demo and team process — other teams should run the
same three questions on their own sources before scaling.
12. REFERENCES
- Share your Gemini sources using Drive projects
https://support.google.com/drive/answer/16684520 - Use Gemini in Drive for research & analysis
https://support.google.com/drive/answer/16963068 - Google Drive: https://drive.google.com
- New project: https://project.new
- Source Document: https://drive.google.com/drive/folders/1YHBqoZePZVQ-GBb8lBDrGHFloTjopVoe?usp=sharing